Error Reporting aggregates error events produced in your running cloud services. An error event represents a single occurrence of an error in your application. The data stored for each event includes information about the error, such as the time at which it occurred, the context in which it occurred, and the error message that was returned.
Error events are either reported by the Error Reporting API or are inferred by Error Reporting when it inspects log entries for common text patterns such as stack traces. Error Reporting groups error events that are considered to have the same root cause.
Error Reporting is automatically enabled.
Error Reporting samples up to 1,000 errors per hour. When this limit is reached, the displayed counts are estimated. If too many events are received, then Error Reporting samples up to 100 errors per hour and continue to extrapolate the counts.
When Error Reporting analyzes log entries
Error Reporting is a global service built on Cloud Logging and can analyze log entries when all of the following are true:
- Assured workloads are disabled. For more information, see Overview of Assured Workloads.
- Customer-managed encryption keys (CMEK) are disabled on all log buckets that store the log entry. Error Reporting can't store log entries in log buckets that have CMEK enabled. For information about how to determine the CMEK configuration for a log bucket, see Verify key enablement.
- The log bucket satisfies one of the following:
- The log bucket is stored in the same project where the log entries originated.
- The log entries were routed to a project, and then that project stored those log entries in a log bucket that it owns.
How error events are grouped
When Error Reporting evaluates log entries to identify error events, it ignores log entries with the following conditions:
- Log entries written by App Engine standard environment that have a
severity level lower than
ERROR. - Stack frames which aren't owned by the user (for instance, those that belong to public libraries).
When a log entry is scanned, Error Reporting makes the following modifications before inferring error events:
- Replaces any repeating sequence of one or more stack frames with a single occurrence of that sequence.
- Removes compiler-introduced methods and symbols.
Error Reporting applies these rules, in the specified order, to group error events:
| Error Event | Grouped by |
|---|---|
| Error events caused by a general problem in the environment.
For example, App Engine specific problems: com.google.apphosting.runtime.HardDeadlineExceededError com.google.appengine.api.datastore.DatastoreTimeoutException Java problems: java.util.concurrent.CancellationException |
Grouped by exception type. |
| Error events with a stack trace. In the case of nested
exceptions, the innermost exception is considered.
For example: runtime error: index out of range
package1.func1()
file1:20
package2.func2()
file2:33 |
Grouped by exception type and the 5 top-most frames. |
| Error events without a stack trace, but with a message.
For example: runtime error: index out of range
func1() |
Grouped by message and (if present) function name. Only the first 3 literal
tokens of the message are considered. In the example to the left, these
are runtime, error, and index. |
Data regionality
If you set up Assured Workloads for data-residency or Impact Level 4 (IL4) requirements, then Google Cloud automatically disables Error Reporting.
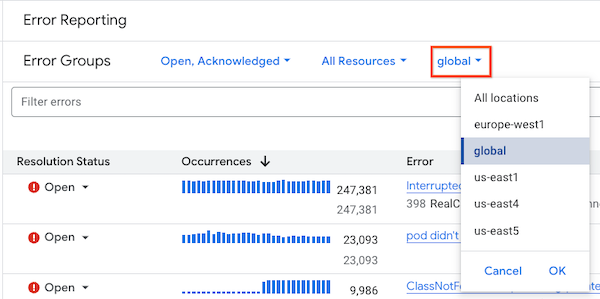
In Cloud Logging, you can regionalize your logs by routing
them to a specific location. On the Error Groups page,
Error Reporting organizes and shows error groups based on the
region of the log bucket that contains the log entries. For example,
an error group listed under us-central-1 contains only error logs
that are part of a log bucket in us-central-1. Global error groups contain
only error logs that are part of a log bucket in the global region.
To filter the region of the error groups displayed on the Error Groups page,
select a value from the Region menu. This menu has a default value of
global.