Log querying in Google Distributed Cloud (GDC) air-gapped lets you inspect operational and
audit events across your project workloads after
[collecting logs](https://docs.cloud.google.com/distributed-cloud/hosted/docs/latest/gdcag/platform/pa-user/collect-logs.md.txt). You can filter,
visualize, and export log streams in the Grafana Log panel with Log Query
Language (LogQL) expressions. For programmatic workflows, query your
organization's [Log Query
API](https://docs.cloud.google.com/distributed-cloud/hosted/docs/latest/gdcag/apis/service/logging/v1/goog.gdc.logging.v1) over HTTP or gRPC
by following [standard API access methods](https://docs.cloud.google.com/distributed-cloud/hosted/docs/latest/gdcag/apis/apis-overview.md.txt).
## Before you begin
To query and visualize logs, you must have the necessary permissions.
### Request IAM organization roles
Contact your IAM Org Admin to request the following roles:
- **Organization Grafana Viewer** (`organization-grafana-viewer`): visualize organization-related observability data on dashboards of the Grafana monitoring instance.
- **Log Querier** (`log-query-api-querier-pa`): access the Log Query API to query platform logs in the `platform-obs` project.
### Request IAM project roles
Contact your IAM Project Admin to request the following roles:
- **Project Grafana Viewer** (`project-grafana-viewer`): visualize project-related observability data on dashboards of the Grafana monitoring instance in the project namespace.
- **Log Querier** (`log-query-api-querier`): access the Log Query API to query application logs in the project namespace.
The following table summarizes the `Role` requirements for the PA and AO
personas:
| Persona | Object | Cluster | Role | Namespace | Group/User |
|---|---|---|---|---|---|
| PA | `grafana` | management API server | `project-grafana-viewer` | `platform-obs` | Group |
| PA | `log-query-api` | management API server | `log-query-api-querier-pa` | `platform-obs` | Group |
| PA | `grafana` | management API server | `project-grafana-viewer` | `platform-obs` | User |
| PA | `log-query-api` | management API server | `log-query-api-querier-pa` | `platform-obs` | User |
| AO | `grafana` | management API server | `project-grafana-viewer` | `PROJECT_NAMESPACE` | Group |
| AO | `log-query-api` | management API server | `log-query-api-querier` | `PROJECT_NAMESPACE` | Group |
| AO | `grafana` | management API server | `project-grafana-viewer` | `PROJECT_NAMESPACE` | User |
| AO | `log-query-api` | management API server | `log-query-api-querier` | `PROJECT_NAMESPACE` | User |
Select one of the following configurations to grant Grafana access to a user
group (`Config 1`) or an individual user (`Config 2`) on the management API
server. For each configuration, you can either run the `kubectl` command to
create the `RoleBinding` directly, or save the `RoleBinding` YAML manifest to
the specified Infrastructure as Code (IaC) file path to apply it through GitOps:
> [!IMPORTANT]
> **Important:** Before committing the configuration to your IaC repository, ensure that the `kustomization.yaml` file exists in the folder where you create the YAML file.
### Config 1
This configuration grants permissions to a user group to access PA and AO
Grafana on the management API server. After setting up this configuration,
refer to the [Grafana dashboards](https://docs.cloud.google.com/distributed-cloud/hosted/docs/latest/gdcag/platform/pa-user/query-and-view-logs.md.txt#grafana-endpoint) section of this document
to view logs on Grafana.
- **kubectl command**
Run the following command to create the `RoleBinding` directly:
```bash
kubectl --kubeconfig KUBECONFIG create rolebinding RULE_NAME -n platform-obs --group=GROUP_NAME --role=project-grafana-viewer
```
**Example:**
```bash
kubectl --kubeconfig KUBECONFIG_PATH create rolebinding project-grafana-viewers-binding --role=project-grafana-viewer --group=my-team --namespace=platform-obs
```
- **IaC file path**
Alternatively, to manage the `RoleBinding` using IaC, create the YAML file
at the following path:
```bash
/infrastructure/zonal/zones/ZONE/org-admin/rolebindings/GROUP_NAME/YAML_FILE
```
- **YAML file**
Save the following `RoleBinding` manifest in the YAML file at the IaC file
path:
```yaml
apiVersion: rbac.authorization.k8s.io/v1
kind: RoleBinding
metadata:
name: RULE_NAME
namespace: platform-obs
subjects:
- kind: Group
name: GROUP_NAME
apiGroup: rbac.authorization.k8s.io
roleRef:
kind: Role
name: project-grafana-viewer
apiGroup: rbac.authorization.k8s.io
```
### Config 2
This configuration grants permissions to a user to access PA and AO Grafana on
the management API server. After setting up this configuration, refer to the
[Grafana dashboards](https://docs.cloud.google.com/distributed-cloud/hosted/docs/latest/gdcag/platform/pa-user/query-and-view-logs.md.txt#grafana-endpoint) section of this document to view logs
on Grafana.
- **kubectl command**
Run the following command to create the `RoleBinding` directly:
```bash
kubectl --kubeconfig KUBECONFIG create rolebinding RULE_NAME -n platform-obs --user=EMAIL_ADDRESS --role=project-grafana-viewer
```
**Example:**
```bash
kubectl --kubeconfig KUBECONFIG_PATH create rolebinding project-grafana-viewers-binding --role=project-grafana-viewer --user=my-email@example.com --namespace=platform-obs
```
- **IaC file path**
Alternatively, to manage the `RoleBinding` using IaC, create the YAML file
at the following path:
```bash
/infrastructure/zonal/zones/ZONE/org-admin/rolebindings/EMAIL_ADDRESS/YAML_FILE
```
- **YAML file**
Save the following `RoleBinding` manifest in the YAML file at the IaC file
path:
```yaml
apiVersion: rbac.authorization.k8s.io/v1
kind: RoleBinding
metadata:
name: RULE_NAME
namespace: platform-obs
subjects:
- kind: User
name: EMAIL_ADDRESS
apiGroup: rbac.authorization.k8s.io
roleRef:
kind: Role
name: project-grafana-viewer
apiGroup: rbac.authorization.k8s.io
```
Replace the following:
- `KUBECONFIG`: the path to the kubeconfig file for the specific cluster that contains the `NAMESPACE` where this `RoleBinding` is applied.
- `KUBECONFIG_PATH`: the path to the kubeconfig file in the example commands.
- `RULE_NAME`: the unique name for this `RoleBinding` resource within the namespace, such as `pa-project-grafana-viewer`.
- `NAMESPACE`: the Kubernetes namespace where this `RoleBinding` is created and applied. Look for the `Namespace` column in the previous table.
- `EMAIL_ADDRESS`: the identifier for the user being granted the role, such as `application-operator@example.com`.
- `ROLE`: the name of the `Role` that contains the permissions you want to grant to the user. Look for the roles available in the previous table.
- `GROUP_NAME`: the name of the `Group` to which the PA user belongs, such as `pa-group`.
- `ZONE`: the name of the zone.
- `YAML_FILE`: the name of the YAML file for the `RoleBinding` resource.
For more information about these roles, see
[Prepare IAM permissions](https://docs.cloud.google.com/distributed-cloud/hosted/docs/latest/gdcag/platform/pa-user/obs-iam-permissions.md.txt).
## Query and filter your logs
Select one of the following methods to build queries and filter logs from your
project workloads:
> [!NOTE]
> **Note:** A single log query in Loki can scan a maximum of 200 GB of log data and return up to 5,000 log lines at a time. To avoid exceeding these limits on large log volumes, narrow your query time range or refine your label filters. For more information, see [System limits](https://docs.cloud.google.com/distributed-cloud/hosted/docs/latest/gdcag/resources/system-limits.md.txt#logging).
### Grafana Log panel
This section describes how to access your logs using the Log panel in Grafana.
#### Identify your Grafana endpoint
The following URL is the endpoint of the Grafana instance of your project:
```bash
https://GDC_URL/PROJECT_NAMESPACE/grafana
```
Replace the following:
- `GDC_URL`: the URL of your organization in GDC.
- `PROJECT_NAMESPACE`: your project namespace.
For example, the Grafana endpoint for the `platform-obs` project in the
`org-1` organization is `https://org-1/platform-obs/grafana`.
#### View logs in the Grafana user interface
Query logs in the Grafana user interface:
1. In the GDC console, select your project.
2. In the navigation menu, select **Operations** \> **Logging**.
3. Click **View all in Grafana Loki**.
A new page opens your [Grafana endpoint](https://docs.cloud.google.com/distributed-cloud/hosted/docs/latest/gdcag/platform/pa-user/query-and-view-logs.md.txt#grafana-endpoint) and
displays the user interface.
4. On the user interface,
click explore **Explore**
from the navigation menu to open the **Explore** page.
5. From the menu at the **Explore** bar, select a data source to retrieve
logs, according to your universe type:
- **Single-zone universes**: Select one of the following data
sources to display logging data from the single zone of your universe:
- **Operational logs**: Display operational logs.
- **Audit logs**: Display audit logs.
- **Multi-zone universes**: Grafana can connect to different zones
and show cross-zone data. Select one of the following data sources
to display logging data from any zone of your universe, regardless
of the zone you are signed in:
- **Operational logs ZONE_NAME**: Display operational logs from a particular zone.
- **Audit logs ZONE_NAME**: Display audit logs from a particular zone.
Additionally, to have cross-zone data visualizations in a single
dashboard and add multiple zones to your query, select **Mixed** as
the data source.
> [!NOTE]
> **Note:** Audit logs are only available to Platform Administrators, even if they cannot create or configure audit logging targets. Application Operators can only access operational logs.
6. Enter a query to search for logs from the Log panel using
[LogQL](https://grafana.com/docs/loki/latest/logql/)
(Log Query Language) expressions. You can do this step in either
of the following ways:
- Use the interactive query-builder interface. Then, click **Run query**.
- Enter your query directly in the text field and press Shift+Enter to run the query.
The page displays the logs matching your query. After querying logs, you
can export them. Click **Export** to download logs in plain text or CSV
formats. You can also [select a time range for your logs](https://docs.cloud.google.com/distributed-cloud/hosted/docs/latest/gdcag/platform/pa-user/query-and-view-logs.md.txt#select-time-range).
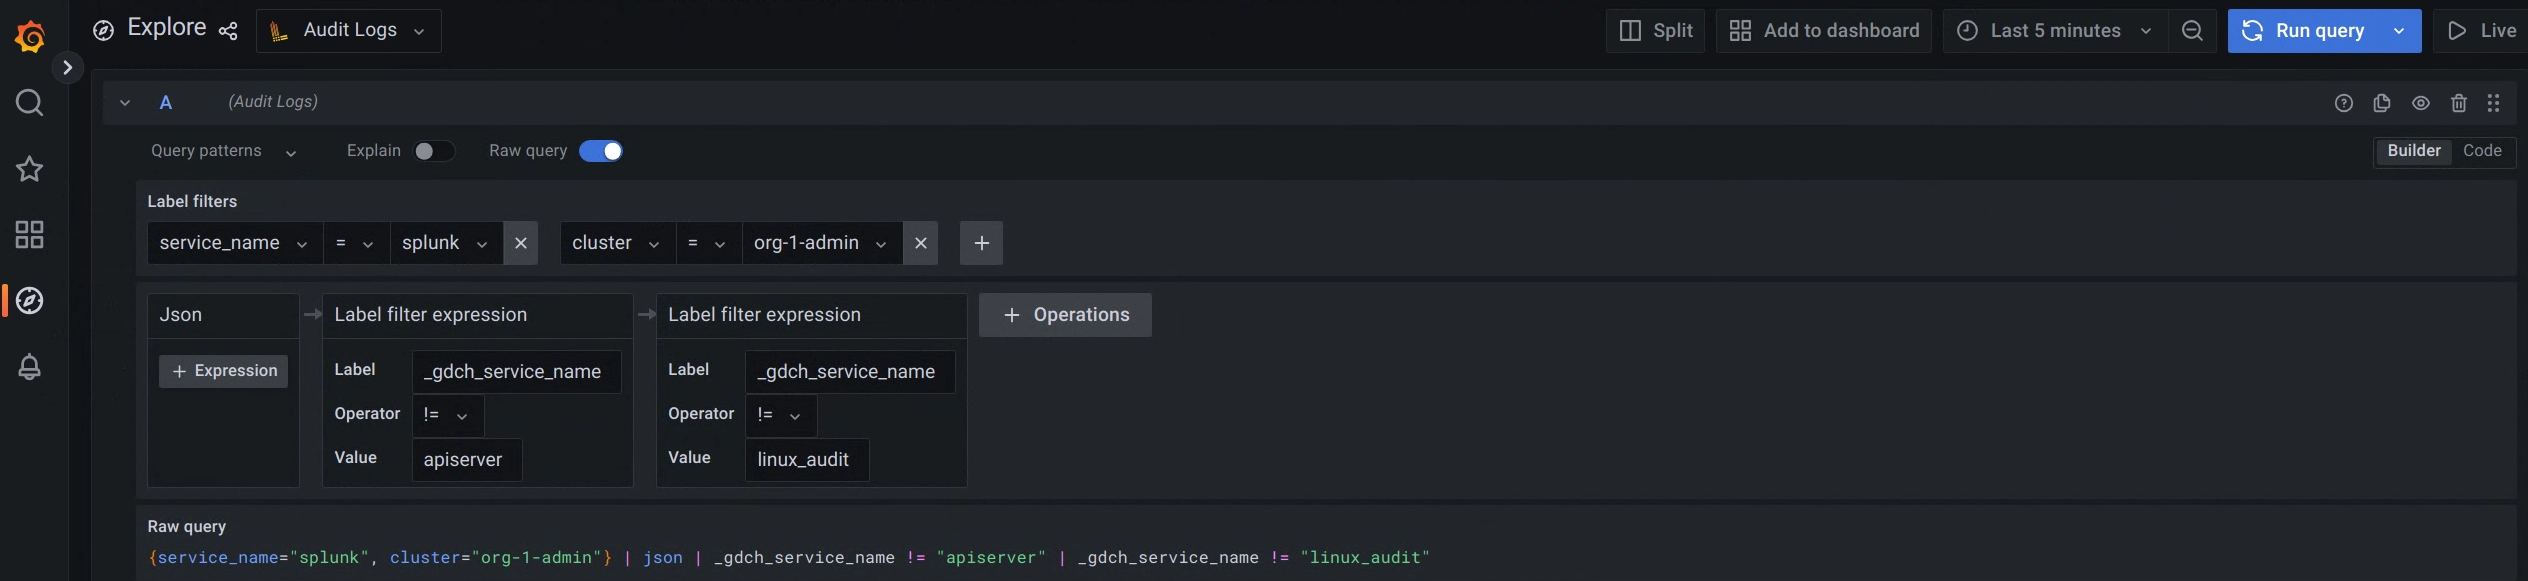
**Figure 1.** Menu option to query audit logs from the Grafana user
interface.
In figure 1, the **Audit logs** option displays the interface that lets
you build queries from Grafana to retrieve audit logs.
For examples of labels and values to query different logs, see
[Sample queries and labels](https://docs.cloud.google.com/distributed-cloud/hosted/docs/latest/gdcag/platform/pa-user/query-and-view-logs.md.txt#sample-queries-and-labels).
#### Select a time range for your logs
To query logs in a time range, follow these steps:
1. Click the **Time Picker**
menu in Grafana.
2. From the menu, perform one of the following actions:
- Select relative time range options, for example, the last 30 minutes.
- Set custom absolute time ranges by choosing specific dates and times from the calendar and clicking **Apply time range**.
3. Optionally, click **Change time settings** to change the **Timezone**
and **Fiscal year** settings from the time range controls.
Time settings are saved on a per-dashboard basis. For more information
about queries over a range of time, see
.
### Log Query API
This section describes how to access your logs using the Log Query API.
#### Identify your Log Query API endpoint
The [Log Query API](https://docs.cloud.google.com/distributed-cloud/hosted/docs/latest/gdcag/apis/service/logging/v1/goog.gdc.logging.v1.md.txt)
exposes the following two endpoints to query audit and operational logs:
- **Audit log endpoint:**
```bash
audit-log-query-api.ORG_DOMAIN
```
> [!NOTE]
> **Note:** Audit logs are only available to Platform Administrators, even if they cannot create or configure audit logging targets. Application Operators can only access operational logs.
- **Operational log endpoint:**
```bash
operational-log-query-api.ORG_DOMAIN
```
Replace `ORG_DOMAIN` with the domain name of the
organization. You can view this property by using the `gdcloud config list`
command. The domain name must follow the syntax
`org-name.zone.google.gdch.com`. For example, an organization named `org-1`,
in the `zone1` zone, and in a test environment has a domain like
`org-1.zone1.google.gdch.test`.
The Log Query API has the following three endpoint options:
- **labels**: List all labels for a project.
- **labels/labels/LABEL/values**: List specific label values for a project.
- **logs**: List logs for a specific project.
For more information, see the [API documentation](https://docs.cloud.google.com/distributed-cloud/hosted/docs/latest/gdcag/apis/service/logging/v1/goog.gdc.logging.v1.md.txt).
#### Send a query
Send a query to the [Log Query API endpoint](https://docs.cloud.google.com/distributed-cloud/hosted/docs/latest/gdcag/platform/pa-user/query-and-view-logs.md.txt#log-query-api-endpoint) using
HTTP or gRPC clients.
### HTTP
Follow the instructions to
[directly access the API with an HTTP client](https://docs.cloud.google.com/distributed-cloud/hosted/docs/latest/gdcag/apis/apis-overview.md.txt#direct-access-api-http-client).
You can rely on `kubectl` to manage the authentication or handle the
authentication yourself.
Query the Log Query API using HTTP clients like `curl`, `wget`, or an
HTTP client that you create and manage. The following example uses the
`curl` tool to query the API, and you can use a similar format for
`wget` commands:
1. Authenticate the cURL request:
1. [Download and install the gdcloud CLI](https://docs.cloud.google.com/distributed-cloud/hosted/docs/latest/gdcag/resources/gdcloud-overview.md.txt).
2. [Set](https://docs.cloud.google.com/distributed-cloud/hosted/docs/latest/gdcag/resources/gdcloud-reference/gdcloud-config-set.md.txt)
the gdcloud `core/organization_console_url`
property:
```bash
gdcloud config set core/organization_console_url https://GDC_URL
```
Replace `GDC_URL`
with the URL of an organization in GDC.
3. [Sign in with the configured identity provider](https://docs.cloud.google.com/distributed-cloud/hosted/docs/latest/gdcag/resources/gdcloud-auth.md.txt#sign-in-with-idp):
```bash
gdcloud auth login
```
4. Use your user and password to authenticate and sign in.
5. Export the identity token for the specified account to an
environment variable:
```bash
export TOKEN="$($HOME/gdcloud auth print-identity-token --audiences=https://LOG_QUERY_API_ENDPOINT)"
```
Replace `LOG_QUERY_API_ENDPOINT` with the
[Log Query API endpoint](https://docs.cloud.google.com/distributed-cloud/hosted/docs/latest/gdcag/platform/pa-user/query-and-view-logs.md.txt#log-query-api-endpoint) from where you
want to query logs and the domain you want to connect to. Therefore,
the value for the `audiences` flag can be, for example,
`https://operational-log-query-api.org-1.zone1.google.gdch.test`.
When the login is successful, you can use the authorization header
in your cURL request through the `gdcloud auth print-identity-token`
command. For more information, see
[gdcloud auth print-identity-token](https://docs.cloud.google.com/distributed-cloud/hosted/docs/latest/gdcag/resources/gdcloud-reference/gdcloud-auth-print-identity-token.md.txt).
2. If you want to list all labels for a project, send the following query:
```bash
curl -H "Authorization: Bearer ${TOKEN}" \
https://LOG_QUERY_API_ENDPOINT/v1/projects/PROJECT_NAMESPACE/labels \
-H "Content-Type: application/json" -v
```
Replace the following:
- `LOG_QUERY_API_ENDPOINT`: the [Log Query API endpoint](https://docs.cloud.google.com/distributed-cloud/hosted/docs/latest/gdcag/platform/pa-user/query-and-view-logs.md.txt#log-query-api-endpoint) from where you want to query logs.
- `PROJECT_NAMESPACE`: your project namespace.
3. If you want to list specific label values for a project, send the
following query:
```bash
curl -H "Authorization: Bearer ${TOKEN}" \
https://LOG_QUERY_API_ENDPOINT/v1/projects/PROJECT_NAMESPACE/labels/labels/LABEL/values \
-H "Content-Type: application/json" -v
```
Replace the following:
- `LOG_QUERY_API_ENDPOINT`: the [Log Query API endpoint](https://docs.cloud.google.com/distributed-cloud/hosted/docs/latest/gdcag/platform/pa-user/query-and-view-logs.md.txt#log-query-api-endpoint) from where you want to query logs.
- `PROJECT_NAMESPACE`: your project namespace.
- `LABEL`: the specific label for which you want to query its value.
4. If you want to query logs for a specific project, construct a
`logs_filter` query and include it in the body of the request:
```bash
curl -X GET -H "Authorization: Bearer ${TOKEN}" \
https://LOG_QUERY_API_ENDPOINT/v1/projects/PROJECT_NAMESPACE/logs \
-H "Content-Type: application/json" -d \
'{"logs_filter": {"labels_equal": {"LABEL": "LABEL_VALUE"}}}' -v
```
Replace the following:
- `LOG_QUERY_API_ENDPOINT`: the [Log Query API endpoint](https://docs.cloud.google.com/distributed-cloud/hosted/docs/latest/gdcag/platform/pa-user/query-and-view-logs.md.txt#log-query-api-endpoint) from where you want to query logs.
- `PROJECT_NAMESPACE`: your project namespace.
- `LABEL`: the specific label for which you want to query logs.
- `LABEL_VALUE`: the label value for which you want to query logs.
Refer to the [API documentation](https://docs.cloud.google.com/distributed-cloud/hosted/docs/latest/gdcag/apis/service/logging/v1/goog.gdc.logging.v1.md.txt)
to see all options for constructing a `logs_filter` query.
### gRPC
gRPC is widely supported across programming languages and provides a more
efficient communication method compared to HTTP clients.
To query logs using gRPC, you must meet the following prerequisites:
- Create your own client library based on Google-supplied protocol buffers.
- Implement authentication in the client.
- Implement retries.
For information about the protocol buffers, see the
[API documentation](https://docs.cloud.google.com/distributed-cloud/hosted/docs/latest/gdcag/apis/service/logging/v1/goog.gdc.logging.v1.md.txt).
The following example shows how to query logs from a Go program using a
non-authenticated gRPC client. The example assumes you created a golang
package that includes a Bazel build file to import code dependencies:
1. Save the following code to a Go program named `client.go`:
```go
package main
import (
"context"
"crypto/tls"
"flag"
"fmt"
"google.golang.org/grpc/credentials"
"google.golang.org/grpc/metadata"
pb "/pkg/apis/public/logging/v1/proto"
"google.golang.org/grpc"
)
var serverAddr = flag.String("server", "localhost:8080", "server address")
func main() {
flag.Parse()
tc := credentials.NewTLS(&tls.Config{InsecureSkipVerify: true})
conn, err := grpc.Dial(*serverAddr, grpc.WithTransportCredentials(tc))
if err != nil {
panic(error.Error(fmt.Errorf("create client connection failed: %v", err)))
}
defer conn.Close()
c := pb.NewLogsClient(conn)
md := metadata.Pairs("clienttest", "test")
ctx := metadata.NewOutgoingContext(context.Background(), md)
err = listLabels(ctx, c, "project-foo")
if err != nil {
panic(error.Error(err))
}
if err := listLabelValues(ctx, c, "project-foo", "resource-bar"); err != nil {
panic(error.Error(err))
}
if err := listLogs(ctx, c, "project-foo", &pb.ListLogsFilter{
LabelsEqual: map[string]string{"resource-bar": "resource-bar-value"},
OrderAscending: true,
}); err != nil {
panic(error.Error(err))
}
}
// List all labels for a project.
func listLabels(ctx context.Context, c pb.LogsClient, project string) error {
lbr := &pb.ListLabelsRequest{
Parent: project,
PageSize: 1000, // PageSize can be configured to limit the number of responses per page.
}
resp, err := c.ListLabels(ctx, lbr)
if err != nil {
return fmt.Errorf("list labels: %v", err)
}
fmt.Printf("%v", resp)
return nil
}
// List specific label values for a project.
func listLabelValues(ctx context.Context, c pb.LogsClient, project string, label string) error {
lbr := &pb.ListLabelValuesRequest{
Parent: project,
Label: label,
PageSize: 1000, // PageSize can be configured to limit the number of responses per page.
}
resp, err := c.ListLabelValues(ctx, lbr)
if err != nil {
return fmt.Errorf("list label values: %v", err)
}
fmt.Printf("%v", resp)
return nil
}
// List logs for a specific project.
func listLogs(ctx context.Context, c pb.LogsClient, project string, lf *pb.ListLogsFilter) error {
lbr := &pb.ListLogsRequest{
Parent: project,
LogsFilter: lf,
PageSize: 5, // PageSize can be configured to limit the number of responses per page.
}
resp, err := c.ListLogs(ctx, lbr)
if err != nil {
return fmt.Errorf("list logs: %v", err)
}
fmt.Printf("logs: %v", resp)
return nil
}
```
2. Run the Go program:
```bash
go run PATH_TO_API/client.go -server=LOG_QUERY_API_ENDPOINT:443
```
Replace the following:
- `PATH_TO_API`: the path to the API file.
- `LOG_QUERY_API_ENDPOINT`: the [Log Query API endpoint](https://docs.cloud.google.com/distributed-cloud/hosted/docs/latest/gdcag/platform/pa-user/query-and-view-logs.md.txt#log-query-api-endpoint) from where you want to query logs.
If the server flag is not specified, the default request gets to
`localhost`.
## Sample queries and labels
The following are some of the default labels that you can use to query logs:
- `cluster`: the name of the cluster.
- `namespace`: your project namespace.
- `node`: the node name.
- `pod`: the pod name.
- `container`: the container name.
The following code samples show the use of labels and values to query different
logs:
- Select server logs:
```json
{cluster="admin", namespace="kube-system", resources="k8s_container", container="kube-apiserver"}
```
- Select cluster audit logs:
```json
{cluster="admin", resources="k8s_audit"}
```