
このドキュメントでは、Spark 指標について説明します。デフォルトでは、 Managed Service for Apache Spark は、 利用可能な Spark 指標の収集を有効にします。ただし、 Spark 指標収集プロパティ を使用して、1 つ以上の Spark 指標の収集を無効にするかオーバーライドしない限りです。
Managed Service for Apache Spark バッチ ワークロードを送信するときに設定できる追加のプロパティについては、Spark プロパティをご覧ください。
Spark 指標のコレクション プロパティ
このセクションでリストされているプロパティを使用して、1 つ以上の利用可能な Spark 指標の 収集を無効またはオーバーライドできます。
| プロパティ | 説明 |
|---|---|
spark.dataproc.driver.metrics |
Spark ドライバの指標を無効またはオーバーライドするために使用します。 |
spark.dataproc.executor.metrics |
Spark エグゼキュータの指標を無効またはオーバーライドするために使用します。 |
spark.dataproc.system.metrics |
Spark システムの指標を無効にするために使用します。 |
gcloud CLI の例:
Spark ドライバの指標の収集を無効にします。
gcloud dataproc batches submit spark \
    --properties spark.dataproc.driver.metrics="" \
    --region=region \
    other args ...
BlockManager:disk.diskSpaceUsed_MB指標とDAGScheduler:stage.failedStages指標のみを収集するように、Spark のデフォルトのドライバ指標の収集をオーバーライドします。gcloud dataproc batches submit spark \ --properties=^~^spark.dataproc.driver.metrics="BlockManager:disk.diskSpaceUsed_MB,DAGScheduler:stage.failedStages" \ --region=region \ other args ...
利用可能な Spark 指標
custom.googleapis.com/METRIC_EXPLORER_NAME。
Spark ドライバの指標
| 指標 | Metrics Explorer 名 |
|---|---|
| BlockManager:disk.diskSpaceUsed_MB | spark/driver/BlockManager/disk/diskSpaceUsed_MB |
| BlockManager:memory.maxMem_MB | spark/driver/BlockManager/memory/maxMem_MB |
| BlockManager:memory.memUsed_MB | spark/driver/BlockManager/memory/memUsed_MB |
| DAGScheduler:job.activeJobs | spark/driver/DAGScheduler/job/activeJobs |
| DAGScheduler:job.allJobs | spark/driver/DAGScheduler/job/allJobs |
| DAGScheduler:messageProcessingTime | spark/driver/DAGScheduler/messageProcessingTime |
| DAGScheduler:stage.failedStages | spark/driver/DAGScheduler/stage/failedStages |
| DAGScheduler:stage.runningStages | spark/driver/DAGScheduler/stage/runningStages |
| DAGScheduler:stage.waitingStages | spark/driver/DAGScheduler/stage/waitingStages |
Spark エグゼキュータの指標
| 指標 | Metrics Explorer 名 |
|---|---|
| ExecutorAllocationManager:executors.numberExecutorsDecommissionUnfinished | spark/driver/ExecutorAllocationManager/executors/numberExecutorsDecommissionUnfinished |
| ExecutorAllocationManager:executors.numberExecutorsExitedUnexpectedly | spark/driver/ExecutorAllocationManager/executors/numberExecutorsExitedUnexpectedly |
| ExecutorAllocationManager:executors.numberExecutorsGracefullyDecommissioned | spark/driver/ExecutorAllocationManager/executors/numberExecutorsGracefullyDecommissioned |
| ExecutorAllocationManager:executors.numberExecutorsKilledByDriver | spark/driver/ExecutorAllocationManager/executors/numberExecutorsKilledByDriver |
| LiveListenerBus:queue.executorManagement.listenerProcessingTime | spark/driver/LiveListenerBus/queue/executorManagement/listenerProcessingTime |
| executor:bytesRead | spark/executor/bytesRead |
| executor:bytesWritten | spark/executor/bytesWritten |
| executor:cpuTime | spark/executor/cpuTime |
| executor:diskBytesSpilled | spark/executor/diskBytesSpilled |
| executor:jvmGCTime | spark/executor/jvmGCTime |
| executor:memoryBytesSpilled | spark/executor/memoryBytesSpilled |
| executor:recordsRead | spark/executor/recordsRead |
| executor:recordsWritten | spark/executor/recordsWritten |
| executor:runTime | spark/executor/runTime |
| executor:shuffleFetchWaitTime | spark/executor/shuffleFetchWaitTime |
| executor:shuffleRecordsRead | spark/executor/shuffleRecordsRead |
| executor:shuffleRecordsWritten | spark/executor/shuffleRecordsWritten |
| executor:shuffleRemoteBytesReadToDisk | spark/executor/shuffleRemoteBytesReadToDisk |
| executor:shuffleWriteTime | spark/executor/shuffleWriteTime |
| executor:succeededTasks | spark/executor/succeededTasks |
| ExecutorMetrics:MajorGCTime | spark/executor/ExecutorMetrics/MajorGCTime |
| ExecutorMetrics:MinorGCTime | spark/executor/ExecutorMetrics/MinorGCTime |
System metrics
| 指標 | Metric Explorer 名 |
|---|---|
| agent:uptime | agent/uptime |
| cpu:utilization | CPU / 使用率 |
| disk:bytes_used | disk/bytes_used |
| disk:percent_used | disk/percent_used |
| memory:bytes_used | memory/bytes_used |
| memory:percent_used | memory/percent_used |
| network:tcp_connections | network/tcp_connections |
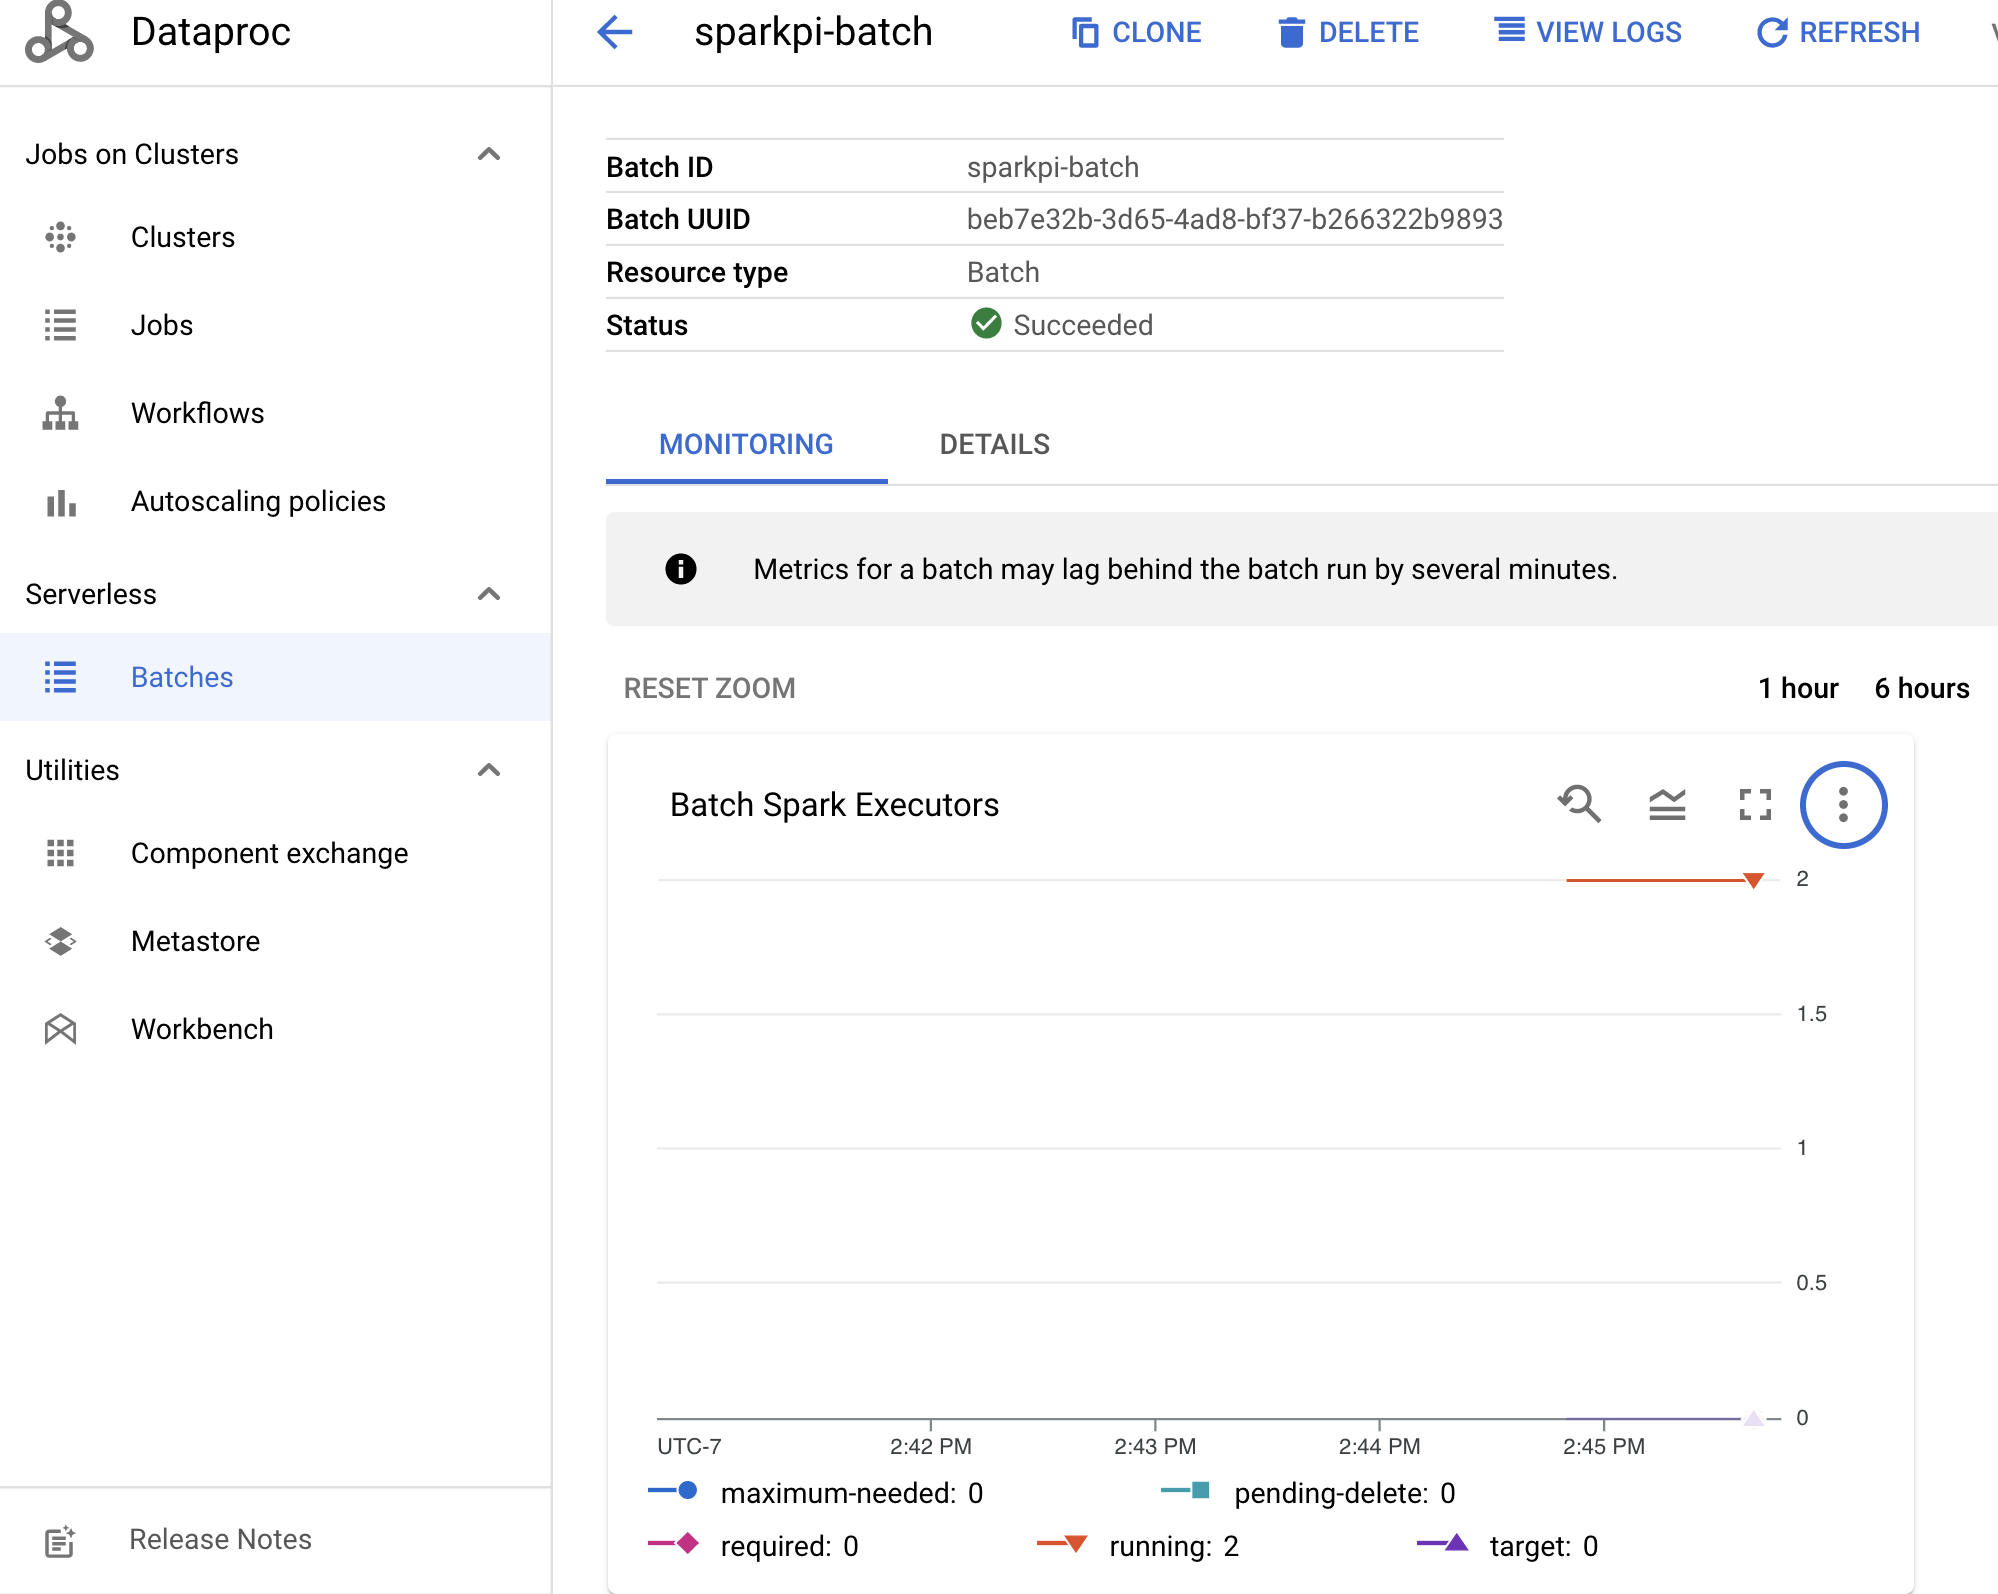
Spark 指標を表示
Batch 指標を表示するには、コンソールの Managed Service for Apache Spark [バッチ] ページでバッチ ID をクリックし、バッチの [詳細] ページを開きます。 このページには、[モニタリング タブ] の下にバッチ ワークロードの指標グラフが表示されます。Google Cloud
収集された指標を表示する方法の詳細については、Managed Service for Apache Spark Cloud Monitoring をご覧ください。