This document teaches you how to access Cloud Billing Reports in the
Google Cloud console and how to configure reports, providing details on how to
use the various report settings, filters, and report features to track and
understand your Google Cloud usage costs.
## View your billing reports and cost trends
Use the Reports page to view and analyze your Google Cloud usage cost and
cost trends using a variety of configurable settings and filters. The Reports
page displays a chart that plots usage costs for a Cloud Billing
account, including costs in all projects linked to the billing account. To help
you view the cost trends that are important to you, you can specify a time
range, configure the report filters, and group your data by a variety of
options, such as by project, service, SKU, or location.
[See common report configuration scenarios](https://docs.cloud.google.com/billing/docs/how-to/reports#common-scenarios).
[Video](https://www.youtube.com/watch?v=XR_d8u5AGyM)
Cloud Billing reports can help you answer questions like these:
- How is my current month's Google Cloud spend trending?
- How much am I spending on AI overall and by a detailed breakdown?
- Which Google Cloud project cost the most last month?
- Which Google Cloud service (for example, Compute Engine or Cloud Storage) cost me the most?
- How do my daily costs per Google Cloud service compare over time?
- What are my forecasted future costs based on historical trends?
- How much am I spending by region?
- What was the cost of resources with label X?
[See common report configuration scenarios](https://docs.cloud.google.com/billing/docs/how-to/reports#common-scenarios).
> [!NOTE]
> **Note:** Historical *usage and cost* data is available back to January 2017. Data filtered by *Billing period* (formerly *Invoice month* ) is available back to January 2019. For more information, see [Data availability](https://docs.cloud.google.com/billing/docs/how-to/reports#data_availability).
## Permissions required to access reports
Depending on your level of Cloud Billing access, you can view cost
reports for a *Cloud Billing account* (including viewing the costs for
*all* of the projects linked to the billing account), or you can view cost
reports limited to the *Google Cloud projects* for which you have cost view access.
### Full billing account permissions
To view all costs for a Cloud Billing account,
you need permissions on the
*Cloud Billing account*.
Cloud Billing account permissions are granted
using roles on the billing account. To view the cost
reports for your Cloud Billing account, including
viewing the cost information for *all* of the Google Cloud projects
that are linked to the billing account, you need a role on your
*Cloud Billing account* that includes the following
[permissions](https://docs.cloud.google.com/iam/docs/understanding-roles#billing-roles):
- `billing.accounts.get`
- `billing.accounts.getIamPolicy`
- `billing.accounts.getSpendingInformation`
To gain these permissions using a
[predefined role](https://docs.cloud.google.com/iam/docs/choose-predefined-roles), ask your administrator to grant you one of the
following
[Cloud Billing IAM roles](https://docs.cloud.google.com/billing/docs/how-to/billing-access) on your
Cloud Billing account:
- Billing Account Viewer
- Billing Account Costs Manager
- Billing Account Administrator
### Project-scoped billing permissions
Depending on your level of Cloud Billing access for project costs,
you can access the tools in Cloud Billing to view aggregated costs
and other billing data for multiple projects linked to a
Cloud Billing account, or you can view billing information for
individual projects, one project at a time.
For more information about project-limited permissions for viewing costs in
Cloud Billing accounts, see
[project-scoped access to Cloud Billing accounts](https://docs.cloud.google.com/billing/docs/how-to/project-owners/setup-multi-project-access#project-permissions).
| Access a billing account for *multiple* Google Cloud projects | Access billing for an *individual* Google Cloud project |
|---|---|
| To view *aggregated* billing data for all of your authorized Google Cloud projects, you need a *combination* of project and billing account permissions: - **Projects** : you need billing-specific cost view permissions on *each Google Cloud project* . Project permissions are granted with roles on the *Google Cloud project or folder* . At a minimum, you need the following permissions on each project: - `billing.resourceCosts.get` - `resourcemanager.projects.get` - **Cloud Billing account** : you need project-scoped billing permissions on the *Cloud Billing account* that is [linked to your authorized projects](https://docs.cloud.google.com/billing/docs/how-to/view-linked). Billing account permissions are granted using roles on the *Cloud Billing account* . For multi-project-scoped access to the billing account, you need the following role on the *Cloud Billing account*: - [Project Billing Costs Manager](https://docs.cloud.google.com/billing/docs/how-to/billing-access#billing.projectCostsManager) Learn more about the [permissions required for multi-project-scoped access to Cloud Billing accounts](https://docs.cloud.google.com/billing/docs/how-to/project-owners/setup-multi-project-access#required-permissions). | To access Cloud Billing to view costs for an *individual* Google Cloud project, one project at a time, you only need *billing-specific* permissions on the *Google Cloud project*. - **Projects** : you need billing-specific cost view permissions on *each Google Cloud project* you want to view. Project permissions are granted with roles on the *Google Cloud project or folder* . At a minimum, you need the following permissions on each project: - `billing.resourceCosts.get` - `resourcemanager.projects.get` - **Cloud Billing account permissions aren't required** : If you are viewing billing information for one project at a time, you don't need permissions on the Cloud Billing account that is [linked to your authorized Google Cloud project](https://docs.cloud.google.com/billing/docs/how-to/view-linked). Learn more about the [*project* permissions required for *single-project-scoped access* to Cloud Billing accounts](https://docs.cloud.google.com/billing/docs/how-to/project-owners/setup-multi-project-access#project-permissions). |
|---|---|
| For more information about *Cloud Billing permissions*, see: - [Overview of Cloud Billing access control](https://docs.cloud.google.com/billing/docs/how-to/billing-access) - [Create custom roles for Cloud Billing](https://docs.cloud.google.com/billing/docs/how-to/custom-roles) - [Understanding predefined Identity and Access Management roles for Cloud Billing](https://docs.cloud.google.com/iam/docs/choose-predefined-roles) | For more information about Google Cloud *project permissions*, see: - [Access control for projects with IAM](https://docs.cloud.google.com/resource-manager/docs/access-control-proj) - [IAM basic and predefined roles reference](https://docs.cloud.google.com/iam/docs/roles-overview#basic) |
## Access the reports page
To view the cost reports for your Cloud Billing account or projects,
follow the procedure that fits your
[level of access to Cloud Billing accounts](https://docs.cloud.google.com/billing/docs/how-to/reports#required-permissions).
Cost reports for a Cloud Billing account are accessible in the Billing
section of the Google Cloud console.
### Full billing account permissions
If you have full Cloud Billing account permissions, you
can select from a list of billing accounts that you have permissions to
access.
1. In the Google Cloud console, go to your Cloud Billing
account.
[Go to your Cloud Billing account](https://console.cloud.google.com/billing/reports)
2. At the prompt, **choose the Cloud Billing account** for which you'd like to view cost reports.
The Billing **Reports** page opens for the selected billing
account using
[default settings](https://docs.cloud.google.com/billing/docs/how-to/reports#read-the-chart), displaying all costs for the current month, grouped
by service.
When you access reports with full *billing-account-level permissions*, you can see costs for *all* of the projects that are
linked to the Cloud Billing account, and you can use the
[Gemini Cloud Assist in Cloud Billing](https://docs.cloud.google.com/billing/docs/how-to/gemini/overview)
features on the \*\*Reports\*\* page.
### Project-scoped cost view permissions
Depending on your level of Cloud Billing access for project costs,
you can access the tools in Cloud Billing to view aggregated costs
and other billing data for multiple projects linked to a
Cloud Billing account, or you can view billing information for
individual projects, one project at a time.
| View costs in a billing account for *multiple* Google Cloud projects | View costs for an *individual* Google Cloud project |
|---|---|
| When you are granted cost view permissions on *each Google Cloud project* , and have the [Project Billing Costs Manager](https://docs.cloud.google.com/billing/docs/how-to/billing-access#billing.projectCostsManager) role on the *Cloud Billing account* that is linked to your projects, you can view aggregated billing data for all of your authorized projects. 1. In the Google Cloud console, go to your Cloud Billing account. [Go to your Cloud Billing account](https://console.cloud.google.com/billing/reports) 2. At the prompt, **choose the Cloud Billing account** for which you'd like to view cost reports. The Billing **Reports** page opens for the selected billing account using [default settings](https://docs.cloud.google.com/billing/docs/how-to/reports#read-the-chart), displaying costs for all of your authorized projects, for the current month, grouped by service. When you have multi-project-scoped access to billing reports, you can configure the [Projects filter](https://docs.cloud.google.com/billing/docs/how-to/reports#filter-by-projects) to view costs for one or many projects, and you can use the [Gemini Cloud Assist in Cloud Billing](https://docs.cloud.google.com/billing/docs/how-to/gemini/overview) features on the \*\*Reports\*\* page. | **Important** : If you only have project permissions, but don't have any permissions on your project's Cloud Billing account, you'll need to select your project *before* you navigate to the Billing section. 1. Sign in to the Google Cloud console dashboard and select a project. [Open Google Cloud console](https://console.cloud.google.com/projectselector2/home/dashboard?project=_) 2. **Select a project** for which you'd like to view cost reports. 3. Next, **navigate to Billing** : Open the Google Cloud console **Navigation menu** , and then select **Billing** . If you're prompted to choose which billing account you want to view and manage, click **Go to linked billing account** to view the billing account that's linked to your selected project. The Billing **Reports** page opens for the selected billing account. As a project user accessing the Cloud Billing account using *project-level permissions only*, you can see costs for a *single* project -- the project that you selected in the Google Cloud console *before* you accessed the Billing section. You can also use the [Gemini Cloud Assist in Cloud Billing](https://docs.cloud.google.com/billing/docs/how-to/gemini/overview) features on the \*\*Reports\*\* page for your selected project. |
| **Note** : If you are viewing Cloud Billing reports using *project-level permissions* only, some of the *billing-account-level* report features aren't available, such as [generate a SQL query](https://docs.cloud.google.com/billing/docs/how-to/reports#generate-query) and [access and save custom reports](https://docs.cloud.google.com/billing/docs/how-to/reports#saving-views). ||
> [!NOTE]
> **Note:** Gemini Cloud Assist features aren't available on the Report when you're viewing a [Cloud Billing *Subaccount*](https://docs.cloud.google.com/billing/docs/concepts#subaccounts).
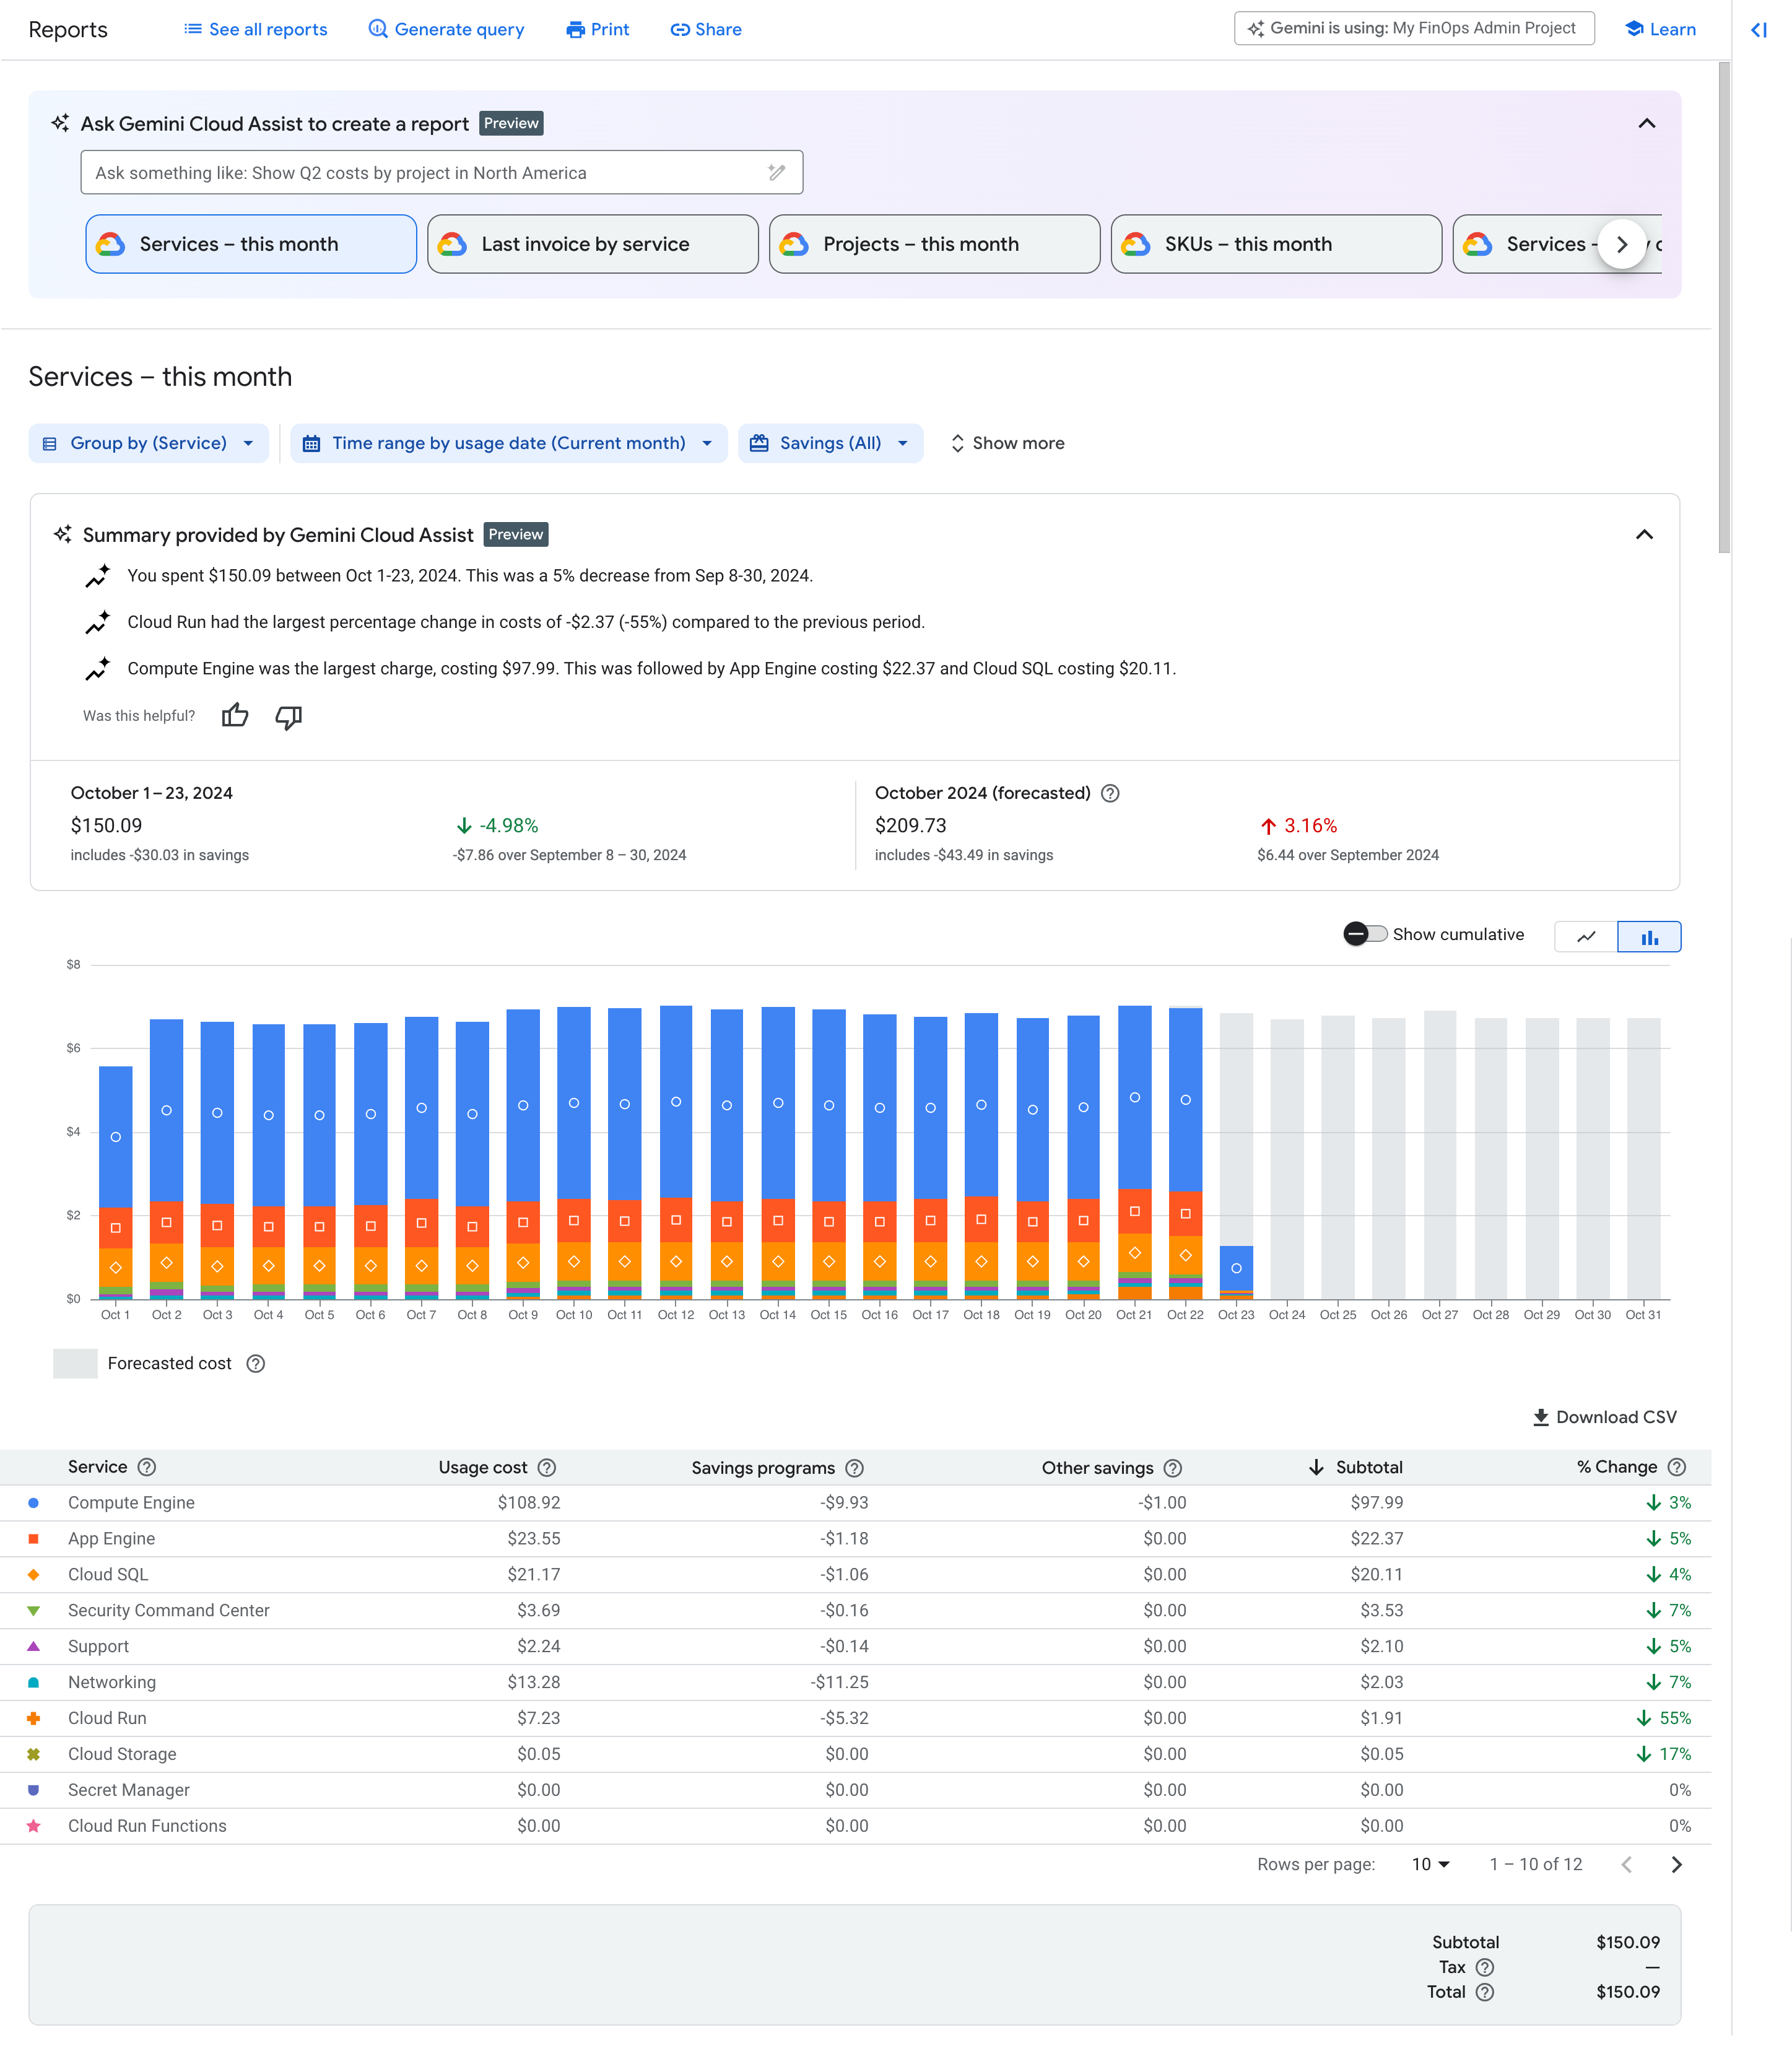
## About the default Cloud Billing report
Based on your report filters and other settings, the report chart displays a
stacked bar chart where each bar plots costs over time. The
[**Group by** setting](https://docs.cloud.google.com/billing/docs/how-to/reports#group-by)
determines what each stack in the bar represents --- each grouping gets its
own stack in the bar chart and row in the table.
By default, the report uses the
[**Services --- this month** preset report view](https://docs.cloud.google.com/billing/docs/how-to/reports#preset_views),
which returns a report showing the current calendar month's daily cost for all
services and SKUs, grouped by Service.
The Gemini Cloud Assist features are available above the report
header. Gemini features include
[saved reports](https://docs.cloud.google.com/billing/docs/how-to/gemini/overview#saved-reports),
[Gemini-assisted reports creation](https://docs.cloud.google.com/billing/docs/how-to/gemini/overview#gemini-ai-reports),
and [report summaries](https://docs.cloud.google.com/billing/docs/how-to/gemini/overview#report-summaries).
The following information explains how to interpret the different sections of
the report when using the default report view:
- For a quick view of your actual cost totals compared to
forecasted costs, use the **report header** above the report chart. The
**report header** includes the following information:
- Actual cost-to-date for the current month, including total savings, and a percent change indicator to show you if your overall costs are trending up or down compared to the previous time period.
- Total forecasted cost for the entire current month, including forecasted savings, and a percent change indicator to show you how your forecasted costs are trending compared to the previous time period.
- For a daily summary and breakdown of costs by service, view the
**report chart**. The chart displays the current month's daily
usage-specific costs grouped by service (for all Google Cloud
projects), including any usage-specific savings applied.
- The chart also includes forecasted costs, indicated in the chart in
light gray, helping you visualize how your forecasted costs are
trending.
- Each stacked bar in the chart (and row in the table) corresponds
to the service, ranked largest to smallest by subtotal.
- For cost totals by service, view the **report table** . The table shows
a row for each service that incurred usage-specific costs and savings for
the month,
[sorted](https://docs.cloud.google.com/billing/docs/how-to/reports#data_order)
by the **Subtotal** column in descending order.
> [!NOTE]
> **Note:** *Usage-specific* costs and savings don't include account-level costs and credits reported on your invoice (for example, taxes, contractual credits, or surcharges). To include invoice-level costs and credits, set your **Time range** filter to **Billing period** (formerly *Invoice month* ). For more information, see [Data availability](https://docs.cloud.google.com/billing/docs/how-to/reports#data_availability).
- For a quick view of your actual, usage-specific cost
totals, look at the **report footer**, below the table.
The values that display in the footer depend on the report's time range
settings, filters, and your permission level for viewing costs in the
Cloud Billing account. When viewing the report using a
*Billing period* (formerly *Invoice month* ) time range, the footer totals
can include
[invoice-level costs and credits](https://docs.cloud.google.com/billing/docs/how-to/reports#invoice-charges)
such as taxes and adjustments. If your permissions limit your billing report
access to viewing costs for a single project, you won't see invoice-level
charges.
Note that the report's default settings are different if you access the
report from the
[Budget and alerts](https://docs.cloud.google.com/billing/docs/how-to/budgets)
page---the report's timeframe and filters are configured using the budget's
*scope* settings. For details, see
[Viewing a budget in your report](https://docs.cloud.google.com/billing/docs/how-to/reports#budget-in-report).
## Manage report settings and filters
 Click image to view an enlarged version.

Use the various report settings and filters to customize the report view.
You can select a
[preset report](https://docs.cloud.google.com/billing/docs/how-to/reports#preset_views) or
[saved report](https://docs.cloud.google.com/billing/docs/how-to/reports#saving-views),
and you can further refine the data displayed in the report by adjusting the
[**Time range**](https://docs.cloud.google.com/billing/docs/how-to/reports#time-range),
[**Group by**](https://docs.cloud.google.com/billing/docs/how-to/reports#group-by),
and the various report
[**Filters**](https://docs.cloud.google.com/billing/docs/how-to/reports#filters).
You can
[ask Gemini Cloud Assist](https://docs.cloud.google.com/billing/docs/how-to/reports#ask-gemini)
to create a report.
> [!IMPORTANT]
> **Key Point:** As you configure your report by setting the **Time range** , **Group by** , and other **Filters** , your report output and view changes. You can [save your report view](https://docs.cloud.google.com/billing/docs/how-to/reports#saving-views), [share or bookmark the URL of a customized report](https://docs.cloud.google.com/billing/docs/how-to/reports#share-report), [generate a SQL query from the report](https://docs.cloud.google.com/billing/docs/how-to/reports#generate-query), or [download the report data to a comma-separated values (CSV) file](https://docs.cloud.google.com/billing/docs/how-to/reports#download-to-csv).
### Ask Gemini Cloud Assist to find or create a report
[Gemini Cloud Assist in Cloud Billing](https://docs.cloud.google.com/billing/docs/how-to/gemini/overview)
helps you analyze your costs. On Reports, you can
[ask Gemini Cloud Assist to create a report](https://docs.cloud.google.com/billing/docs/how-to/gemini/overview#gemini-ai-reports).
When prompted, Gemini interprets your request and automatically
configures the report settings and filters to create the report for you.

#### Gemini Cloud Assist limitations
- Some report settings and filters can't be configured by
Gemini Cloud Assist, including the following filters or
group-by options:
- Products
- Originating products
- Spend-based CUDs
- Originating services
- Applications
For each report setting that Gemini Cloud Assist can't
configure, the report will instead use the
[default setting](https://docs.cloud.google.com/billing/docs/how-to/reports#read-the-chart).
For example, if you prompt Gemini Cloud Assist to create a
report for the *last 30 days* with costs grouped by *Originating product* ,
the resulting report will show costs for the *last 30 days* but grouped
by *Service* (the default Group-by option).
- Gemini Cloud Assist features aren't available on the Report
when you're viewing a
[Cloud Billing *Subaccount*](https://docs.cloud.google.com/billing/docs/concepts#subaccounts).
### Use preset reports for quick configuration

Cloud Billing provides several recommended reports with preconfigured
settings that you can select for efficient access to your usage and cost data.
- Select **See all reports** to open a comprehensive list of reports, including your [custom saved reports](https://docs.cloud.google.com/billing/docs/how-to/reports#saving-views) and the Google Cloud-created, recommended preset reports.
- You can access the most frequently viewed of the preset reports and your custom saved reports in a carousel that displays below the *Ask Gemini Cloud Assist* prompt field. You can scroll the reports carousel left and right to select a report.
The following Google Cloud-created, preconfigured report views are
available:
| Preset reports using a [*Charge period*](https://docs.cloud.google.com/billing/docs/how-to/reports#usage-date) (formerly *Usage date*) time range ||
|---|---|
| **Services --- this month** (default) | **Time range** : Current month. **Group by** : Service. **Description** : The current calendar month's daily cost for all services and SKUs, grouped by *Service* (for example, Compute Engine or Cloud Storage), including any usage-specific savings applied, but not including invoice-level charges or credits such as taxes and adjustments. |
| [**Live costs by SKU**](https://docs.cloud.google.com/billing/docs/how-to/reports/live-costs) | **Time range** : Last 15 days. **Group by** : SKU. **Description** : For the last 15 days, the *actual* and *live costs* for all services and SKUs, in all projects, grouped by *SKU*, excluding any usage-specific savings or credits. Live costs are *gross, estimated* costs that are available in near-real-time for limited SKUs from eligible services and don't include credits. When spend caps or anomaly alerts are triggered, live costs can help you identify which specific SKUs, services, or projects are driving your costs. |
| **Projects --- this month** | **Time range** : Current month. **Group by** : Project. **Description** : The current calendar month's daily cost for all services and SKUs, grouped by *Project*, including any usage-specific savings applied, but not including invoice-level charges and credits such as taxes and adjustments. |
| **SKUs --- this month** | **Time range** : Current month. **Group by** : SKU. **Description** : The current calendar month's daily cost for all services and SKUs, grouped by *SKU*, including any usage-specific savings applied, but not including invoice-level charges and credits such as taxes and adjustments. |
| **Services --- daily costs this month** | **Time range** : Current month. **Group by** : Date \> Service. **Description** : The current calendar month's daily cost for all services and SKUs, grouped by *Date \> Service*, including any usage-specific savings applied. In the report table, expand the row for a day to see your daily costs summarized per service. This view doesn't include invoice-level charges and credits such as taxes and adjustments. |
| **Projects --- daily costs this month** | **Time range** : Current month. **Group by** : Date \> Project. **Description** : The current calendar month's daily cost for all services and SKUs, grouped by *Date \> Project*, including any usage-specific savings applied. In the report table, expand the row for a day to see your daily costs summarized per project. This view doesn't include invoice-level charges and credits such as taxes and adjustments. |
| **SKUs --- daily costs this month** | **Time range** : Current month. **Group by** : Date \> SKU. **Description** : The current calendar month's daily cost for all services and SKUs, grouped by *Date \> SKU*, including any usage-specific savings applied. In the report table, expand the row for a day to see your daily costs summarized per SKU. This view doesn't include invoice-level charges and credits such as taxes and adjustments. |
| [**Gemini Enterprise costs by SKU**](https://docs.cloud.google.com/billing/docs/how-to/reports/gemini-enterprise-costs) | **Time range** : Current month. **Group by** : SKU. **Filter by** : *Gemini Enterprise* Originating products. **Description** : The current calendar month's daily cost for all *Gemini Enterprise* services and SKUs, filtered by *Originating products* and grouped by *SKU*, including any usage-specific savings applied, but not including invoice-level charges and credits such as taxes and adjustments. |
| **Services --- daily costs L7D** | **Time range** : Last seven days. **Group by** : Date \> Service. **Description** : The daily costs for the last seven days (L7D) for all services and SKUs, grouped by *Date \> Service*, including any usage-specific savings applied. In the report table, expand the row for a day to see your daily costs summarized per service. This view doesn't include invoice-level charges and credits such as taxes and adjustments. |
| Preset reports using a [*Billing period*](https://docs.cloud.google.com/billing/docs/how-to/reports#invoice-month) (formerly *Invoice month*) time range ||
|---|---|
| **Last invoice by service** | **Time range** : Most recent invoice month. **Group by** : Service. The most recent, complete invoice month's daily cost for all services and SKUs, grouped by Service; including savings and [invoice-level charges](https://docs.cloud.google.com/billing/docs/how-to/reports#invoice-charges), such as tax; aggregated by total invoice costs for the invoice month, not by individual invoices\*. If your permissions limit your billing report access to viewing costs for a single project, you won't see invoice-level charges. |
| **Last invoice by project** | **Time range** : Most recent invoice month. **Group by** : Project. The most recent, complete invoice month's daily cost for all services and SKUs, grouped by Project; including savings and [invoice-level charges](https://docs.cloud.google.com/billing/docs/how-to/reports#invoice-charges), such as tax; aggregated by total invoice costs for the invoice month, not by individual invoices\*. If your permissions limit your billing report access to viewing costs for a single project, you won't see invoice-level charges. |
| **Last invoice by SKU** | **Time range** : Most recent invoice month. **Group by** : SKU. The most recent, complete invoice month's daily cost for all services and SKUs, grouped by SKU; including savings and [invoice-level charges](https://docs.cloud.google.com/billing/docs/how-to/reports#invoice-charges), such as tax; aggregated by total invoice costs for the invoice month, not by individual invoices\*. If your permissions limit your billing report access to viewing costs for a single project, you won't see invoice-level charges. |
| **Note** : Billing Reports aggregates all invoice costs for the *invoice month* , not by individual invoice. If you receive more than one invoice in a month, your *invoice month* totals might not map to the totals of an individual invoice issued in the same month. If you want to view detailed costs per *individual invoice* , see the [**cost table report**](https://docs.cloud.google.com/billing/docs/how-to/cost-table). ||
## Set the **Time range** for the report data


The type of **Time range** that you select, and the time period that you
configure, affects your ability to view certain types of costs on the report
(such as
[forecasted costs](https://docs.cloud.google.com/billing/docs/how-to/reports#cost-forecast)
or [invoice-level charges](https://docs.cloud.google.com/billing/docs/how-to/reports#invoice-charges)).
You can select between **Charge period** (formerly *Usage date* ) or
**Billing period** (formerly *Invoice month*) time range types,
then set a date or month range to view the Google Cloud costs
incurred during the specified time period.
When you select **Charge period** (formerly *Usage date* ), you can choose a
preset or custom time range for charting cost data (available back to January
2017). If you select **Billing period** (formerly *Invoice month*), you can
set a time range based on complete months (available back to May 2019).
A 24-hour time period in the Cloud Billing report starts at midnight
US and Canadian Pacific Time (UTC-8), and observes daylight saving time
shifts in the United States.
| Time range options ||
|---|---|
| ### By Charge period (formerly *Usage date*) | - Returns actual usage and cost data incurred during the date range you specify (available back to January 2017). - Forecasted costs: The report chart includes [forecasted costs](https://docs.cloud.google.com/billing/docs/how-to/reports#cost-forecast) if the date range ends on a *future* date. - Taxes and adjustments: [Invoice-level charges](https://docs.cloud.google.com/billing/docs/how-to/reports#invoice-charges) such as taxes and adjustments *aren't* included in the report when viewing costs for a *Charge period* (formerly *Usage date*) time range. - Negotiated savings: When you set the report time range by **Charge period** (formerly *Usage date*), the **Cost** column displays your costs calculated using the [prices](https://docs.cloud.google.com/billing/docs/how-to/pricing-table) that are applicable to your Cloud Billing account. If your Cloud Billing account is associated with a *custom pricing contract* , the [*negotiated savings*](https://docs.cloud.google.com/billing/docs/how-to/reports/savings-and-credits#contract-pricing) are *included* in the **Cost** calculations. |
| ### By Billing period (formerly *Invoice month*) | - Returns usage costs and invoice-level charges on the invoices issued for the months selected (available back to May 2019). - Invoice-level charges include taxes, contractual credits, adjustments, or surcharges, and are calculated when an invoice is issued. You can view [invoice-level charges](https://docs.cloud.google.com/billing/docs/how-to/reports#invoice-charges) in the report footer when you use a **Billing period** (formerly *Invoice month*) time range, and *all of the other report* [***Filters***](https://docs.cloud.google.com/billing/docs/how-to/reports#filters) are set to show ALL options (such as all Projects, Services, SKUs, and Savings). If your [permissions](https://docs.cloud.google.com/billing/docs/how-to/reports#required-permissions) limit your billing report access to viewing costs for a single project, you won't see invoice-level charges. - Negotiated savings: When you set the report time range by **Billing period** (formerly *Invoice month*), starting with the *May 2021* invoice, Cloud Billing accounts associated with a *custom pricing contract* display [**Negotiated savings**](https://docs.cloud.google.com/billing/docs/how-to/reports/savings-and-credits#contract-pricing) as a savings column, separate from the **List cost** column. List costs are your costs calculated using the [list price](https://docs.cloud.google.com/billing/docs/how-to/pricing-table), prior to applying your *negotiated savings* or any other discounts. - Note that Billing Reports aggregates all invoice costs for the **billing period** *invoice month* , and not by individual invoice. If you receive more than one invoice in a month, your *billing period* totals might not map to the totals of an individual invoice issued in the same month. If you want to view detailed costs per *individual invoice* , see the [**Cost table**](https://docs.cloud.google.com/billing/docs/how-to/cost-table) report. |
## Use **Group by** to summarize costs
Costs in the report are summarized by the **Group by** option that you select.


- The **Group by** option that you select determines the columns and rows that appear in the **report table** , and affects how the data is presented in the **report chart**.
- When using a single-dimension **Group by** option, you can change the sort order of the rows in the **report table** by clicking on a column header. When using a multiple-dimension **Group by** option (such as **Date \> Project** ), the sort order of the rows in the **report table** is fixed and you can't change the order.
- Depending on the [**Time range**](https://docs.cloud.google.com/billing/docs/how-to/reports#time-range) set on the report, when you choose a single-dimension **Group by** option, the data that is displayed in the **report chart** is first grouped by date or month, and then by the single-dimension **Group by** (such as service, project, or SKU). In the **report table** , when using a single-dimension **Group by** option, each row summarizes the costs for the selected option (such as service, project, or SKU).
- Each grouping gets its own bar (or line) in the chart and row in the table.
- The **Group by** option also affects the [report data](https://docs.cloud.google.com/billing/docs/how-to/reports#columns-in-csv) that you can [download to a CSV file](https://docs.cloud.google.com/billing/docs/how-to/reports#download-to-csv).
> [!NOTE]
> **Note:** If you're a *project user* , and are accessing the Cloud Billing account and Billing Report using [*project permissions only*](https://docs.cloud.google.com/billing/docs/how-to/reports#required-permissions), some of the **Group by** options are *not* available.
The **Group by** options include the following:
| Single dimension | Multiple dimension by date | Multiple dimension by month |
|---|---|---|
| Subaccount Project Project Hierarchy Product Originating Product Service Originating Service \> Service SKU Application Location: Region or multi-region\* Spend-based CUDs No grouping (show total cost only) Label keys | Date \> Subaccount Date \> Project Date \> Project Hierarchy Date \> Product Date \> Originating Product Date \> Service Date \> Originating Service \> Service Date \> SKU Date \> Application Date \> Location: Region or multi-region\* Date \> Spend-based CUDs | Month \> Subaccount Month \> Project Month \> Project Hierarchy Month \> Product Month \> Originating Product Month \> Service Month \> Originating Service \> Service Month \> SKU Month \> Application Month \> Location: Region or multi-region\* Month \> Spend-based CUDs |
### Single-dimension *Group by*
options
When using a single-dimension **Group by** option, the **report
table** and the **report chart** display the data differently.
- The **report table** summarizes costs per the selected **Group by** option, creating one row for each.
- The **report chart** shows costs grouped by time, and the selected **Group by** option. If the report's [time range](https://docs.cloud.google.com/billing/docs/how-to/reports#time-range) is set for 62 days or less, the **report chart** automatically shows costs by day. If your time range covers more than 62 days, the **report chart** automatically shows costs by month. Use one of the [multiple-dimension](https://docs.cloud.google.com/billing/docs/how-to/reports#multiple-dimension-groupby) date-based or month-based **Group by** options to control the display of data in the **report chart**.
**Subaccount** If you're viewing a primary billing account with
[subaccounts](https://docs.cloud.google.com/billing/docs/concepts#subaccounts),
you can select this **Group by** option to summarize your costs by
subaccount.
**Note:** You must have [billing-account-level permissions](https://docs.cloud.google.com/billing/docs/how-to/reports#required-permissions) to set this option. The subaccount option is *not available* when viewing the report using *project permissions only*. **Project** When grouped by Project, the **report table** includes columns
for **Project** (this is the project name), **Project ID** , and
**Project number** . When grouping by **Project** , costs that
don't belong to a project display as *\[Charges not specific to a
project\]*.
The **Project number** is a Google-assigned, anonymized
number that's automatically generated for each project you create. In
your support cases and other customer communication, Google refers to
your projects by the project number. The project number persists after
you delete a project, and any costs associated with deleted projects are
identified with the project number.
[Learn more about identifying projects](https://docs.cloud.google.com/resource-manager/docs/creating-managing-projects#identifying_projects).
**Project hierarchy** Project hierarchy is the project's ancestry, the
[resource hierarchy](https://docs.cloud.google.com/resource-manager/docs/cloud-platform-resource-hierarchy) mapping of a project (Organization \> Folder \>
Project). When grouped by **Project hierarchy** , the **report
table** returns a row for each unique combination of
*Organization \> Folder \> Project* , and the table includes columns
for **Project** , **Project ID** , **Project number** , and
**Project hierarchy** . The values listed in the
**Project hierarchy** column show *Organization name \>
Folder name*.
Projects can stand alone or be the child of an organization or folder.
When grouping by **Project hierarchy** , projects that stand alone
display as *\[Project not associated with any folders or
organizations\]*.
The project hierarchy **Group by** option is selectable when the
report's
[**Time range**](https://docs.cloud.google.com/billing/docs/how-to/reports#time-range) is set to *start on or
after January 1, 2022* .
[Learn more about analyzing costs by project hierarchy](https://docs.cloud.google.com/billing/docs/how-to/reports-project-hierarchy).
**Product** A **Product** represents a group of SKUs (possibly from more
than one
[Google Cloud *service*](https://docs.cloud.google.com/billing/docs/how-to/reports#filter-by-services)) that work together and are sold as a
single service, sometimes referred to as a *logical* product family or a
subscription service. Examples include Gemini Enterprise and
Firebase App Hosting.
When grouped by **Product** , the **report table**
shows your costs in the **report chart** summarized by date (or month) and
product, and each row in the **report table** shows your actual costs
and savings summarized by product.
**Originating Product** Originating products are Google Cloud products that cause
usage in another product. For example, Gemini Enterprise is an
originating product when it causes usage in the Gemini Enterprise
app. An Originating Product is conceptually equivalent to a product suite +
product combination.
When grouped by **Originating Product** , the resulting report
shows your costs in the **report chart** summarized by date (or month) and
each *Originating Product* + *Product suite* combination, and each
row in the **report table** shows your actual costs and savings summarized
by each *Originating Product* + *Product suite* combination.
**Service** The default **Group by** setting is **Service** , which shows your costs in the **report chart** summarized by date (or month) and service, and each row in the **report table** shows your actual costs and savings summarized by service, such as Compute Engine and BigQuery. **Originating service \> Service** Originating services are Google Cloud services that cause
usage in another service. When grouped by **Originating service \>
Service** , the **report table** shows your costs in the
**report chart** summarized by date (or month) and
*Originating service*, and each row in the **report table**
shows your actual costs and savings summarized by
*Originating service*.
In the **report table** , you can expand each row for an
*Originating service* to see your costs summarized by each
*Service* that is associated with the *Originating service*.
For example, Google Kubernetes Engine (GKE) can cause usage in Compute Engine.
If you expand the GKE originating service row, you can view the
costs for the Compute Engine service, and any other services where the
costs were triggered by the use of GKE.
**SKU** To analyze the granular details of your costs and savings, group your
costs by SKU. When grouped by SKU, the **report table** includes columns
for **SKU** , **Service** , **SKU ID** , and **Usage** .
Costs and savings are calculated per SKU and
[SKU pricing tiers](https://docs.cloud.google.com/billing/docs/how-to/pricing-table#tiered-pricing).
**Application** When grouped by **Application** , your costs and savings in the **report
table** are summarized by
[App Hub](https://docs.cloud.google.com/app-hub/docs/overview) applications.
App Hub applications might incur usage and costs in more than one
billing account and associated projects. Cost data by application might be
based on partial data, limited to projects and costs for the
Cloud Billing account that you're actively viewing.
When grouping by Application, costs that don't belong to an
App Hub application display as *\[Charges not specific to
an application\]*.
**Location: Region or multi-region\*** When grouped by **Location** , your costs and savings in the **report
table** are summarized by the **Regions** where your applications
are located. When grouping by **Location** , costs that don't
belong to a region or multi-region display as *\[Charges not
specific to a location\]*. Multi-region listings are marked with
an asterisk (for example, us\*).
[Learn more about geography and regions](https://docs.cloud.google.com/docs/geography-and-regions)
**Spend-based CUDs** Grouping by **Spend-based CUDs** summarizes your costs and savings
per commitment type (consumption model). This includes usage costs covered
by the CUD and associated fee SKUs for the CUD consumption model.
**No grouping (show total cost only)** Summarizes the total cost for the specified [time range](https://docs.cloud.google.com/billing/docs/how-to/reports#time-range) and selected filters. **Label keys**
The Label keys selector is located after the *Group by* Month options. Grouping by **Label keys** summarizes costs by each label value that's
paired with the selected label key (for example, key1:value-A, key1:value-B,
key1:value-C). Costs that aren't tagged with the selected **Label
key** are summarized as *\[Charges for other usage\]* .
[Learn more about creating and managing resource labels](https://docs.cloud.google.com/resource-manager/docs/labels-overview).
The Cloud Billing report shows you the cost data for a specific
label only after the label was added to a resource. For example, if you add
the label `environment:dev` to a Compute Engine VM on
January 15, 2024, any analysis for `environment:dev` includes
only the usage for that VM since January 15.
When grouping by label keys, you don't see labels that are applied to a
*project* . You see other user-created labels that you set up and
applied to *Google Cloud services* . For more information, see
[common uses of labels](https://docs.cloud.google.com/resource-manager/docs/labels-overview#common-uses) and
[best practices for using labels](https://docs.cloud.google.com/resource-manager/docs/best-practices-labels).
**Note** : You must have [billing-account-level permissions](https://docs.cloud.google.com/billing/docs/how-to/reports#required-permissions) to set this option. Grouping by Labels is *not available* when viewing the report using *project permissions only*.
### Multiple-dimension *Group by*
options
When using a multiple-dimension **Group by** option, both the **report
table** and the **report chart** display the cost data summarized by date or month, and then broken out by the additional **Group by** dimension.
- The **report table** summarizes costs grouped by date or month, creating one row for each, in descending order, listing the most recent costs first. You can expand a row to view the cost breakdown by the additional **Group by** dimension (such as the daily cost breakdown by service).
- The **report chart** shows costs grouped by date or month plus the additional **Group by** dimension. The sort order in the chart shows the time range in ascending order, from earliest to latest dates or months, when the chart is read from left to right.
**Date-based *Group by* options**
Date \> Subaccount
Date \> Project
Date \> Project Hierarchy
Date \> Product
Date \> Originating Product
Date \> Service
Date \> Originating Service \> Service
Date \> SKU
Date \> Application
Date \> Location: Region or multi-region\*
Date \> Spend-based CUDs When you choose a date-based **Group by** option,
(such as **Date \> Service** ) the **report chart** shows the actual
and forecasted costs for each day, and each row in the **report table**
shows the actual cost for each day. In the **report table** , you can
expand each row for a day to see your daily costs summarized by the
additional dimension (such as the daily cost breakdown by service). For
example, if you choose **Date \> Project**, you can see each day's costs
broken down by project.
If your
[time range](https://docs.cloud.google.com/billing/docs/how-to/reports#time-range) is set to span more than 366 days, the date-based
**Group by** options aren't selectable. You can use the month-based
**Group by** options.
**Month-based *Group by* options**
Month \> Subaccount
Month \> Project
Month \> Project Hierarchy
Month \> Product
Month \> Originating Product
Month \> Service
Month \> Originating Service \> Service
Month \> SKU
Month \> Application
Month \> Location: Region or multi-region\*
Month \> Spend-based CUDs When you set a
[time range](https://docs.cloud.google.com/billing/docs/how-to/reports#time-range) that spans more than one month, you can choose month-based
**Group by** options (such as **Month \> Service** ). When you choose
a month-based **Group by** option, the **report chart** shows the
actual and forecasted costs for each month, and each row in the **report
table** shows the actual cost for each month. In the **report table** ,
you can expand each row for a month to see your monthly costs summarized by
the additional dimension (such as the monthly cost breakdown by service).
For example, if you choose **Month \> Project**, you can see each month's
costs broken down by project.
## Use **Filters** to refine report data
 Reports page showing horizontal **filter tiles**. Click image to view an enlarged version.

**Filters** refine the data that is returned to your report.
- The **filter tiles** are displayed horizontally above the report.
- Configured filters are displayed with a light blue background. Filters that use the default settings for that filter are displayed with a white background.
- In each **filter tile** , after you open the filter and change the settings, you must click **Apply** to update your report with the filter selections.
- If your Report page is long, as you scroll the page, the **filter tiles** remain visible at the top of the page.
- To undo any filter updates and return the filters to their default state, above the **filter tiles** click **Reset filters**.
- Some filters are only present when applicable to your Google Cloud configuration or your billing account cost data. For example, if you don't have any type of [Savings](https://docs.cloud.google.com/billing/docs/how-to/reports#filter-by-credits) applied to your Google Cloud costs, you won't see the *Savings* filter.
> [!NOTE]
> **Note:** Some filters are only available at a billing account level. If you're a *project user* , and are accessing the Cloud Billing account and Billing Report using [*project permissions only*](https://docs.cloud.google.com/billing/docs/how-to/reports#required-permissions), you won't see some of the filters described here.

Filters
### Subaccounts
If you're viewing a *primary billing account* with [subaccounts](https://docs.cloud.google.com/billing/docs/concepts#subaccounts) you can select all subaccounts (default) or select a subset of subaccounts by clicking them in the list. In the list, you can find subaccounts by Subaccount name and by billing account ID, with the [account IDs displayed under each Subaccount name](https://docs.cloud.google.com/billing/docs/release-notes#March_08_2022).
### Folders \& Organizations
Folders and organizations are part of a
[project hierarchy](https://docs.cloud.google.com/billing/docs/how-to/reports#group-by-project-hierarchy),
the resource hierarchy mapping of a project. If you configure the
**Time range** filter to *start on or after January 1, 2022* ,
you can select all folders or organizations (default) that are
associated with the
[projects that are linked to the Cloud Billing account](https://docs.cloud.google.com/billing/docs/how-to/view-linked),
or select a subset of folders or organizations.
The values in the selector are listed in alphabetical order by
resource name. To determine if a value is an organization or a folder,
look at the
[ID number displayed under each name](https://docs.cloud.google.com/billing/docs/release-notes#March_08_2022).
ID numbers are prefaced with *folders/* or
*organizations/* to indicate the type of resource.
For the Cloud Billing account you're viewing, if none of
the
[linked projects](https://docs.cloud.google.com/billing/docs/how-to/view-linked)
are associated with any folders or organizations, then this filter
option isn't displayed. You can still
[group by Project hierarchy](https://docs.cloud.google.com/billing/docs/how-to/reports#group-by-project-hierarchy).
For projects that don't have any ancestors, the **Project hierarchy
column** displays
`[Project not associated with any folders or organizations]`.
### Products
Google Cloud products consist of a group of SKUs
(potentially from more than one
[Google Cloud *service*](https://docs.cloud.google.com/billing/docs/how-to/reports#filter-by-services))
that work together and are sold as a single service, sometimes referred
to as a *logical* product family or a subscription service. Examples
include Gemini Enterprise and Firebase App Hosting.
You can select all products or select a subset of products by
clicking them in the list.
**Note** : Some charges are not specific to a *product*, such as licensing fees and committed use discounts.
### Originating products
Originating products are Google Cloud products that cause
usage in another product. For example, Gemini Enterprise is an
originating product when it causes usage in the Gemini Enterprise
app. An Originating product is conceptually equivalent to a product suite
+ product combination.
You can select all originating products or select a subset of
originating products by clicking them in the list.
### Spend-based CUDs
Filter by spend-based committed use discounts (CUDs) to see your
CUD-covered costs and discounts per commitment type. This includes
usage costs covered by the CUD and associated fee SKUs for the CUD
consumption model.
For more information, see [Analyze Spend-based CUD discounts](https://docs.cloud.google.com/billing/docs/how-to/reports/savings-and-credits#analyze-cud-discounts).
### Services
Google Cloud services are infrastructure-as-a-service
components that consist of a group of related SKUs. Many services,
including Compute Engine and BigQuery, appear in the
top-level navigation in the Google Cloud console.
You can select all services (default) or select a subset of services
by clicking them in the list. In the list, you can identify the services
by Service name and Service ID, with the
[ID number displayed under each Service name](https://docs.cloud.google.com/billing/docs/release-notes#March_08_2022).
### Originating services
Originating services are Google Cloud services that cause
usage in another service. For example, Google Kubernetes Engine (GKE) can
cause usage in Compute Engine. In this use case, when you are viewing
the Compute Engine usage and costs, GKE is an
originating service when it causes usage in Compute Engine.
You can select all originating services or select a subset of
originating services by clicking them in the list. In the list, you can
identify the originating service by Service name and Service ID, with
the ID number displayed under each Service name.
### Projects
You can select all
[Google Cloud projects linked to the Cloud Billing account](https://docs.cloud.google.com/billing/docs/how-to/view-linked)
(default) or select a subset of projects by clicking them in the list.
In the list, you can find Projects by Project name and by Project ID,
with the
[Project IDs displayed under each Project name](https://docs.cloud.google.com/billing/docs/release-notes#March_08_2022).
If a project is
[shut down or deleted](https://docs.cloud.google.com/resource-manager/docs/creating-managing-projects#shutting_down_projects),
the project is listed only by
[project number](https://docs.cloud.google.com/billing/docs/how-to/reports#group-by-project).
Some costs, such as Support costs, aren't related to a project, and
are shown as `[Charges not specific to a project]`.
If you are viewing the report using
[*multi-project-scoped permissions*](https://docs.cloud.google.com/billing/docs/how-to/reports#required-permissions),
you can select to view costs for one or more of your
authorized projects.
If you're viewing the report using
[*project permissions only*](https://docs.cloud.google.com/billing/docs/how-to/reports#required-permissions),
the **Projects** filter is *limited to a single project*
--- the project that you selected in the Google Cloud console before you
accessed the Billing section. You can't select a different project. If
you want to view the Billing Report for a different project, then you
must exit the Billing section, select a different project using the
Google Cloud console project selector, and then access the Billing section
again.
**Note**: If a project didn't incur any usage for the report's Time range, the project is excluded from the report results in the chart and table.
### SKUs
You can select all SKUs (default) or select a subset of SKUs by clicking them in the list. In the list, you can find SKUs by SKU name and also by service ID/SKU ID, with the [ID numbers displayed under each SKU name](https://docs.cloud.google.com/billing/docs/release-notes#March_08_2022).
To learn more about SKUs, see the
[pricing table report](https://docs.cloud.google.com/billing/docs/how-to/pricing-table).
### Applications
You can select all
[App Hub](https://docs.cloud.google.com/app-hub/docs/overview)
Applications (default) or select a subset of Applications by clicking
them in the list.
App Hub applications might incur usage and costs in more than
one billing account and associated projects. Cost data filtered by
application might be based on partial data, limited to projects and costs
for the Cloud Billing account that you're actively viewing.
To filter on costs that aren't part of an App Hub
application, select *\[Charges not specific to an
application\]*.
### Locations
 
By default, all locations are enabled. Click the location tiles to
filter on a subset of locations by **geography** (such as
*Americas* , *Asia-Pacific* , or *Europe* ), **multi-regions** (such as *Global\** ),
or **regions** (such as *us-east1* ). Specifically, the report
costs are filtered by the **regions** and **multi-regions**
you select.
Use the **geography** tiles to quickly select (or deselect) all
regions and multi-regions in that geography. Multi-region tiles are
marked with an asterisk (for example, `us*`).
Learn more about
[geography and regions](https://docs.cloud.google.com/docs/geography-and-regions).
### Labels
 
Labels are key-value pairs you attach to resource usage (for
example, Compute Engine, Cloud Storage, or Google Kubernetes Engine).
To filter usage costs by label, follow these steps:
1. Expand the **Labels** filter.
2. Select a label **Key**.
3. Select the **Values** under the key that you're filtering on (the default is all values under the selected key).
To add another label with a different key, click **+ Add label** ,
and then select the **key** and **values** for the label
filter.
To remove a label filter, to the right of the label fields click
**Remove** or the **delete** icon
().
When filtering by label keys, you can't select labels applied to a
project. You can select other *user-created* labels that you set
up and applied to Google Cloud services. For more information
about labels, see
[common uses of labels](https://docs.cloud.google.com/resource-manager/docs/labels-overview#common-uses)
and
[best practices for using labels](https://docs.cloud.google.com/resource-manager/docs/best-practices-labels).
**Note** : You must have [billing-account-level permissions](https://docs.cloud.google.com/billing/docs/how-to/reports#required-permissions) to set this option. The **Labels** filter is *not
available* when viewing the report using *project permissions
only*. Label keys for Google Kubernetes Engine If you want to view costs for Google Kubernetes Engine, you can filter your resources using the following label keys: `goog-fleet-project` Filter cluster resources by [fleet host project](https://docs.cloud.google.com/anthos/fleet-management/docs/fleet-concepts#fleet-host-project), if the cluster is registered to a fleet. `goog-k8s-cluster-location` Filter GKE resources by location. `goog-k8s-cluster-name` Filter GKE resources by cluster. `goog-k8s-node-pool-name` Filter cluster resources by node pool. To filter GKE resources using the following label keys, you must [enable cost allocation for your GKE clusters](https://docs.cloud.google.com/kubernetes-engine/docs/how-to/cost-allocations): `k8s-namespace` Filter GKE resources by namespace. `k8s-namespace-labels` Filter GKE resources by [fleet namespace label](https://docs.cloud.google.com/anthos/fleet-management/docs/setup-teams#manage_fleet_namespace_labels).
### Savings
 
You can select all applicable Savings options (default) to include in
the cost calculations, or you can clear some or all of the Savings
options to exclude credits, discounts, and other savings from the cost
calculations.
The **Savings** filter displays only the specific types of savings
that you incurred in your Google Cloud costs. If a particular type of
credit or discount doesn't apply to your Cloud Billing account, you
won't see that *Savings* option in the list.
Learn more about
[viewing your Savings](https://docs.cloud.google.com/billing/docs/how-to/reports/savings-and-credits).
### Invoice level charges
 
If you configure the **Time range** filter to use the
***Billing period*** (formerly *Invoice month*) type,
you can select all invoice-level charges (default) to include in the
cost calculation totals, or you can clear some or all of the
invoice-level options. Invoice-level charges display in the report
header above the chart and in the report footer below the table.
Learn more about
[viewing your charges by invoice](https://docs.cloud.google.com/billing/docs/how-to/reports/charges-on-invoices).
**Note** : You must have full [billing-account-level permissions](https://docs.cloud.google.com/billing/docs/how-to/reports#required-permissions) to set this option. The **Invoice level charges** filter is *not
available* when viewing the report using [*project-scoped permissions only*](https://docs.cloud.google.com/billing/docs/how-to/reports#required-permissions).
## Adjust chart settings
The chart settings affect the display of report data in the *online view* of the
report chart. The chart settings don't change the data that is downloaded to
CSV.
### Costs aggregated over time
Time aggregation affects the display of data in the **report chart** . The report
chart is designed to always display cost data summarized by a time variable and
a secondary **Group by** dimension. Based on the
[time range](https://docs.cloud.google.com/billing/docs/how-to/reports#time-range)
setting you select, the report chart shows cost totals aggregated by day or
month. You can also specify a preferred time aggregation using the
[date-based and month-based **Group by**](https://docs.cloud.google.com/billing/docs/how-to/reports#multiple-dimension-groupby)
options.
In the chart, the sort order by time shows the time range in ascending order,
from earliest to latest dates or months, when the chart is read from left to
right.
To change the chart view to visualize how the costs are *accumulating*
over time, select the **Show cumulative** option for the chart.
A *Daily* time period in the Cloud Billing report starts at midnight
US and Canadian Pacific Time (UTC-8), and observes daylight saving time
shifts in the United States.

### Chart style
You can specify a different chart display style using the
**Line Chart** /**Bar Chart** selector above the chart.
- The **line chart** option displays lines plotted over time for each
**Group by** option. The line chart view helps you visualize cost spikes.

- The **bar chart** option creates a stacked bar chart, with bars plotted over
time. Each bar in the chart is divided into a number of stacked sub-bars,
each one corresponding to a **Group by** option.

### Data order
The data order in the **report chart** and the **report table** depends on the
type of
[**Group by** option](https://docs.cloud.google.com/billing/docs/how-to/reports#group-by)
that you choose to use in the report settings.
- [**Single-dimension *Group by* options**](https://docs.cloud.google.com/billing/docs/how-to/reports#single-dimension-groupby):
When using a single-dimension **Group by** option (for example, **Service** ,
**Project** , or **SKU** ), the order of the data displayed in the stacked line
or bar chart is controlled by the data category you're sorting by in the
**report table** -- indicated by an arrow in the table's column
headers. The *default* sort order is set on the **Subtotal** column, sorting
rows in descending order, from largest to smallest costs.
You can change the sort order of the data by clicking on a
different column header. The direction of the arrow indicates if you're
sorting in descending order -- largest to smallest (down arrow
), or
ascending order -- smallest to largest (up arrow
).
To reverse the sort order on the selected column, click the column header
again.

- [**Multiple-dimension *Group by* options**](https://docs.cloud.google.com/billing/docs/how-to/reports#multiple-dimension-groupby):
When using a multiple-dimension **Group by** option (for example,
*Date \> Service* or *Month \> Project* ), the sort order of rows in the
**report table** is set in descending order, by newest to oldest *date* or *month* .
If you expand a row to view the costs summarized by the additional dimension,
the cost breakdown is sorted on the **subtotal** column in descending order,
from largest to smallest costs.
You can't change the sort order of the report data when you're using a
*multiple-dimension* **Group by** option.

## Generate and run a SQL query against your exported billing data
> [!WARNING]
>
> **Preview**
>
>
> This product or feature is
>
> subject to the "Pre-GA Offerings Terms" in the General Service Terms section
> of the [Service Specific
> Terms](https://docs.cloud.google.com/terms/service-terms#1).
>
> Pre-GA products and features are available "as is" and might have limited support.
>
> For more information, see the
> [launch stage descriptions](https://cloud.google.com/products/#product-launch-stages).
On the Reports page, you use the report settings and filters to refine the data
returned to your report. If you enabled
[Cloud Billing data export to BigQuery](https://docs.cloud.google.com/billing/docs/how-to/export-data-bigquery),
you can generate a SQL query in BigQuery that's configured to
use the equivalent Billing Report
[settings and filters](https://docs.cloud.google.com/billing/docs/how-to/reports#filtering_and_grouping)
to query your exported billing data. When run against your
[exported billing data](https://docs.cloud.google.com/billing/docs/how-to/export-data-bigquery-tables),
the generated query returns the equivalent results in BigQuery
as the results in the Billing Report.

### Prerequisites to generate and run a query
To **generate a query from a Cloud Billing Report**, ensure you and
your Cloud Billing account meet the following requirements:
- On your Cloud Billing account,
[Cloud Billing data export to BigQuery](https://docs.cloud.google.com/billing/docs/how-to/export-data-bigquery)
must be enabled, for either the
[standard usage cost data](https://docs.cloud.google.com/billing/docs/how-to/export-data-bigquery-tables/standard-usage) or
[detailed usage cost data](https://docs.cloud.google.com/billing/docs/how-to/export-data-bigquery-tables/detailed-usage).
> [!NOTE]
> **Note:** If both standard and detailed cost data exports are enabled, when you generate a query, the query is created for the *detailed usage cost* data.
- You must have
[permissions to view costs for your *Cloud Billing account*](https://docs.cloud.google.com/billing/docs/how-to/reports#required-permissions).
If you're viewing the report using project-level permissions that limit you
to accessing costs for a single project, you can't generate a query.
To **run the query in BigQuery**, you need the following
permission:
- You need the
[**BigQuery User** role](https://docs.cloud.google.com/bigquery/docs/dataset-access-controls)
for the
[Google Cloud project that contains the BigQuery dataset](https://docs.cloud.google.com/billing/docs/how-to/export-data-bigquery-setup#project)
being used to store the Cloud Billing data.
- If using custom roles to grant permissions to the billing export project, your
custom role must include the `bigquery.jobs.create` permission.
You generate a SQL query from a Cloud Billing report. The
query is generated to and run in BigQuery. You might have
permissions on your Cloud Billing account that allow you to configure
a report and *generate* a query, without you having the
BigQuery permissions that are required to *run* the query.
### Cost of use to generate and run queries
- In **Billing Reports** , when you **Generate** a SQL query from a billing report, you're **not charged** for this action.
- However, in **BigQuery Studio** , when you **Run** the query to produce results, you **are charged** for that action. The cost depends on the amount of data you query.
For more information about the cost of using BigQuery to store
and analyze your Cloud Billing data, see
[Cost of use](https://docs.cloud.google.com/billing/docs/how-to/export-data-bigquery#cost).
### Generate a query
To create a SQL query to run against your billing data exported to
BigQuery, that returns results equivalent to the console report,
do the following:
1. Go to the [Cloud Billing Reports](https://docs.cloud.google.com/billing/docs/how-to/reports#getting_started) in the Google Cloud console.
2. Set your preferred report
[**Time range** , **Group by** , and other **Filters**](https://docs.cloud.google.com/billing/docs/how-to/reports#filtering_and_grouping)
to create a report.
> [!NOTE]
> **Note:** Some filters and Group-by options are only available in the online cost report, but aren't fields that are included in [BigQuery export schemas](https://docs.cloud.google.com/billing/docs/how-to/export-data-bigquery-tables). When you use filters or Group-by options that are limited to the online report, the *Generate query* button is disabled. The following filters and Group-by options are NOT supported for the *Generate query* tool: Originating products, Products, Spend-based CUDs, Originating services, and Applications.
3. Click **Generate query**.
A new browser window opens for BigQuery Studio, and a SQL query is
generated, configured to query your exported billing data with the equivalent
parameters in use on your Billing Report. In BigQuery Studio, the
project selected is the same project set up in your
[Billing export configuration](https://docs.cloud.google.com/billing/docs/how-to/export-data-bigquery-setup#project).
#### About the generated query
The generated SQL query consists of five clauses, creating a query that returns
the equivalent results of the source Billing Report.
- **SELECT** - Defines the columns that the query will return, including expressions to calculate the values in each column.
- **FROM** - The full path to the [data table that contains the Cloud Billing data exported to BigQuery](https://docs.cloud.google.com/billing/docs/how-to/bq-examples#table-name), specified using three values separated by dots: `project-ID.BQ_dataset_name.BQ_table_name`
- **WHERE** - Equivalent to the Report's [Time range setting](https://docs.cloud.google.com/billing/docs/how-to/reports#time-range) and includes any specific, *non-default* [filter settings](https://docs.cloud.google.com/billing/docs/how-to/reports#filters) you selected on the report.
- **GROUP BY** - Equivalent to the Report's [Group by setting](https://docs.cloud.google.com/billing/docs/how-to/reports#group-by).
- **ORDER BY** - Equivalent to the default [data order setting](https://docs.cloud.google.com/billing/docs/how-to/reports#data_order) for the report (which is based on the selected **Group by** option).
### Run the query
After you generate a query from a Billing Report, you must run the query to
view its results in BigQuery Studio.
> [!CAUTION]
> **Caution:** You might incur BigQuery charges when you *Run* a query in BigQuery Studio. Generating the query from a billing report is free. However, when you *Run* the query to produce results, you're charged for that action. The cost depends on the amount of data you query. For more information, see [Cost of use](https://docs.cloud.google.com/billing/docs/how-to/export-data-bigquery#cost).
1. Follow the [Generate a query](https://docs.cloud.google.com/billing/docs/how-to/reports#generate-bq-sql-query) procedure to create a SQL query in BigQuery Studio.
2. In BigQuery Studio, click **Run** to run the query and view the
query results.
> [!NOTE]
> **Note:** In BigQuery Studio, the project selected is the same project set up in your [Billing export configuration](https://docs.cloud.google.com/billing/docs/how-to/export-data-bigquery-setup#project). If you don't have the necessary level of permissions in the BigQuery project, you might see an *access denied* error, such as: "Access Denied: Project my-billing-project: User does not have `bigquery.jobs.create` permission in project my-billing-project." If you see the *access denied* error, you can't run or save the generated query.
3. After you run the query, you can save the query results using a variety of
options, such as CSV, JSON, a BigQuery table, or Google
Sheets. Select **Save results** to see the available save options.
You can also explore the data with tools such as Sheets, Looker,
or Python. Select **Explore data** to see the available explore options.
### Learn more about BigQuery
- [Introduction to SQL in BigQuery](https://docs.cloud.google.com/bigquery/docs/introduction-sql)
- [Overview of BigQuery analytics](https://docs.cloud.google.com/bigquery/docs/query-overview)
- [Explore using BigQuery in the Google Cloud console](https://docs.cloud.google.com/bigquery/docs/bigquery-web-ui)
- [About BigQuery IAM roles and permissions](https://docs.cloud.google.com/bigquery/docs/access-control)
- [Control access to BigQuery resources with IAM](https://docs.cloud.google.com/bigquery/docs/control-access-to-resources-iam)
- [Estimating BigQuery storage and query costs](https://docs.cloud.google.com/bigquery/docs/estimate-costs)
## Save and share report views
You can set many options to customize your online reports. After configuring
your report settings to create a customized view, you might want to save your
settings to be reused later by you or someone else in your organization who
has the required level of permissions to view reports for the
Cloud Billing account. You can use these options to save and share
your customized report views:
- **Saved reports** : You can select **Save as new** to save the
[chart settings](https://docs.cloud.google.com/billing/docs/how-to/reports#changing_chart_settings)
and the
[**Group by** and **filter** settings](https://docs.cloud.google.com/billing/docs/how-to/reports#filtering_and_grouping)
you selected when configuring your report. **Saved reports** are saved to the
**All reports** page and are available for viewing by users in your
organization with Cloud Billing *account-level* access, who can view
reports for *all* costs and projects for the Cloud Billing account.
- Select **See all reports** to open a comprehensive list of reports, including your custom saved reports and the Google Cloud-created, recommended [preset reports](https://docs.cloud.google.com/billing/docs/how-to/reports#preset_views).
- You can access the most frequently viewed of the preset reports and your custom saved reports in a carousel that displays below the *Ask Gemini Cloud Assist* prompt field. You can scroll the reports carousel left and right to select a report.
- **Share** : Optionally, you can
[share the URL of a customized report](https://docs.cloud.google.com/billing/docs/how-to/reports#share-report)
using the **Share** button. **Share** is a quick option to send the URL of a
customized report to a recipient of your choice, outside of the Reports UI.
As you configure your report by setting filters and groupings, your browser
URL updates to include your selections. You can share the report by
copying the URL. The **Share** feature is available to customers with
Cloud Billing account-level access, as well as to Project Owners,
Project Editors, and Project Viewers who can view Cloud Billing
reports for their specific Google Cloud projects.

### Permissions required to create or access a saved report
The *Saved reports* feature is available in the Reports page to customers who
have the correct level of permissions on the Cloud Billing account.
To interact with the *Saved reports* feature, you must have permissions with
Cloud Billing *account-level* access. The roles with the necessary
permissions are
[Billing Account Administrator](https://docs.cloud.google.com/billing/docs/how-to/billing-access),
[Billing Account Costs Manager](https://docs.cloud.google.com/billing/docs/how-to/billing-access)
or
[Billing Account Viewer](https://docs.cloud.google.com/billing/docs/how-to/billing-access)
on your Cloud Billing account.
- Billing Account Administrators and Billing Account Costs Managers have full access to the *Saved reports* feature, and can [create a new, custom saved report](https://docs.cloud.google.com/billing/docs/how-to/reports#save-new-view), [open any saved report](https://docs.cloud.google.com/billing/docs/how-to/reports#open-saved-view), and [update](https://docs.cloud.google.com/billing/docs/how-to/reports#update-saved-view), [rename](https://docs.cloud.google.com/billing/docs/how-to/reports#rename-saved-view), and [delete](https://docs.cloud.google.com/billing/docs/how-to/reports#delete-saved-view) *custom* saved reports.
- Billing Account Viewers have access to [open a previously created saved report](https://docs.cloud.google.com/billing/docs/how-to/reports#open-saved-view), but can't create new saved reports, or update, rename, or delete any saved reports.
- If you are a Project Owner, Project Editor, or Project Viewer, you can view Cloud Billing reports for your specific Google Cloud projects, including using Google Cloud-provided [preset reports](https://docs.cloud.google.com/billing/docs/how-to/reports#preset_views). However, because this level of billing access doesn't allow you to view *all* costs for *all* projects linked to the Cloud Billing account, you can't create or access *custom saved reports* in the *All reports* page. Instead, you can use the [Share](https://docs.cloud.google.com/billing/docs/how-to/reports#share-report) feature to copy and share the URL of a report you have customized.
For more information about Cloud Billing permissions, see
[Overview of Cloud Billing access control](https://docs.cloud.google.com/billing/docs/how-to/billing-access).
### Save a new report view
1. Go to the [Cloud Billing Reports](https://docs.cloud.google.com/billing/docs/how-to/reports#getting_started) in the Google Cloud console.
2. Set your preferred [**chart settings**](https://docs.cloud.google.com/billing/docs/how-to/reports#changing_chart_settings) and report [**Group by and other Filters**](https://docs.cloud.google.com/billing/docs/how-to/reports#filtering_and_grouping).
3. Next to the report name, click **Save as new**.
4. **Enter a name** for your saved report (required). By default, a name is autofilled based on the selected filters.
5. Click **Save as new**.
### Open a saved report
1. Go to the [Cloud Billing Reports](https://docs.cloud.google.com/billing/docs/how-to/reports#getting_started) in the Google Cloud console.
2. Click **See all reports** in the Reports toolbar.
3. Your custom, saved reports are categorized in the **Your reports** list. You can choose one of your reports, or one of the Google Cloud-provided [preset reports](https://docs.cloud.google.com/billing/docs/how-to/reports#preset_views).
4. Click a **saved report** to open the report with the saved settings and filters. If you have many saved reports, you can *Filter
for a report* by report name to narrow down the list of reports to choose from.
Alternatively, if your custom saved report is one that you frequently view, then
that report might appear in the reports carousel. Your frequently accessed
custom saved reports and the Google Cloud-provided preset reports are
accessible in the carousel that displays below the
*Ask Gemini Cloud Assist* prompt field.
### Update a custom saved report to use different report settings
1. Go to the [Cloud Billing Reports](https://docs.cloud.google.com/billing/docs/how-to/reports#getting_started) in the Google Cloud console.
2. Click **See all reports** in the Reports toolbar.
3. Click one of your **saved reports** to open your report with the saved settings and filters.
4. Update the [**chart settings**](https://docs.cloud.google.com/billing/docs/how-to/reports#changing_chart_settings) and report [**Group by and other Filters**](https://docs.cloud.google.com/billing/docs/how-to/reports#filtering_and_grouping) to produce a different report view.
5. Next to the report name, click **Save**.
6. Select **Save changes** to save the report with the updated settings.
Your updated filter settings are now saved to your *existing saved report*
using the original name of the saved report. If you want to rename
your saved report to reflect the updated setting and filters, follow the
steps to
[rename your saved report](https://docs.cloud.google.com/billing/docs/how-to/reports#rename-saved-view).
### Create a new saved report based on an existing saved report
1. Go to the [Cloud Billing Reports](https://docs.cloud.google.com/billing/docs/how-to/reports#getting_started) in the Google Cloud console.
2. Click **See all reports** in the Reports toolbar.
3. Click one of your **saved reports** to open your report with the saved settings and filters.
4. Update the [**chart settings**](https://docs.cloud.google.com/billing/docs/how-to/reports#changing_chart_settings) and report [**Group by and other Filters**](https://docs.cloud.google.com/billing/docs/how-to/reports#filtering_and_grouping) to produce a different report view.
5. Next to the report name, click **Save** , then select **Save as new**.
6. **Enter a name** for your saved Report (required). By default, a name is autofilled based on the previous report name.
7. Click **Save as new**.
### Rename a saved report
1. Go to the [Cloud Billing Reports](https://docs.cloud.google.com/billing/docs/how-to/reports#getting_started) in the Google Cloud console.
2. Click **See all reports** in the Reports toolbar.
3. Click one of **your reports** to open the saved report that you want to **rename** . Note that you can't rename any of the Google Cloud-provided [preset reports](https://docs.cloud.google.com/billing/docs/how-to/reports#preset_views).
4. To the right of the report name, select the **actions** menu ().
5. Select **Edit report name**.
6. Update the name of your report, and then click **Save**.
### Delete a saved report
1. Go to the [Cloud Billing Reports](https://docs.cloud.google.com/billing/docs/how-to/reports#getting_started) in the Google Cloud console.
2. Click **See all reports** in the Reports toolbar.
3. Click one of **your reports** to open the saved report that you want to **delete** . Note that you can't delete any of the Google Cloud-provided [preset reports](https://docs.cloud.google.com/billing/docs/how-to/reports#preset_views).
4. To the right of the report name, select the **actions** menu ().
5. Select **Delete report**.
6. Select **Delete** to permanently delete the saved report. **This action
can't be undone**.
### Share or bookmark the URL of a customized report
In addition to using the *Saved views* feature, you can bookmark or share
the URL of a report you have customized. As you configure your report by
setting **Filters** and the **Group by** option, your *report page URL* updates
to include your selections.
- You can share the report by copying the URL. Click **Share** to copy the URL to your clipboard.
- Optionally, in your browser, you can bookmark the URL to save the URL with your report settings.
> [!IMPORTANT]
> **Key Point:** As you configure your report by setting **Filters** and the **Group by** option, your report page URL automatically updates to include your selections. It's possible that the URL length limit might be reached if you select many settings (for example, selecting 374 services out of 375). In these instances, the **Share** button is disabled and you see a notification on the reports page: *The URL may no longer reflect your selected filters, due to length limitations*.
## Download filtered report data to a CSV file
You can download the report data to a comma-separated values (CSV) file using
the
**Download CSV** selector located above the summary table. The data that
downloads is limited by any
[filters that you have set](https://docs.cloud.google.com/billing/docs/how-to/reports#filters)
and includes all of the rows and columns in the **report table** , plus
[additional columns](https://docs.cloud.google.com/billing/docs/how-to/reports#columns-in-csv),
depending on the
[**Group by** setting](https://docs.cloud.google.com/billing/docs/how-to/reports#columns-in-csv-group-by)
you select.

### CSV filename
For the Reports data, the filename follows this pattern:
`[Billing Account name]_Reports, [YYYY-MM-DD] - [YYYY-MM-DD].csv`
For example, a CSV file of the Reports data downloaded for a
Cloud Billing account named *My Billing Account* , for a date range
of *October 1 to December 31, 2022*, is named:
`My Billing Account_Reports, 2022-10-01 - 2022-12-31.csv`
#### Duplicate report names
If you download a report with the same *date range* multiple times, then
the default report name will be the same. If you configured your report
with a specific set of parameters, you might want to rename the CSV file to
something that will help you differentiate between reports run using the same
date range but using different report settings or filters.
### Columns in the CSV file download
The columns of data in a CSV file depend on the
[**Group by** setting](https://docs.cloud.google.com/billing/docs/how-to/reports#columns-in-csv-group-by).
Every CSV file includes data for the following **charges and savings**
columns, with amounts aggregated by the selected **Group by** option:
- **Cost** or **List cost** : This is the cost of usage at the *on-demand* rate (list price) before any savings are applied. *Cost* or *List cost* is equivalent to the *Usage cost* column that appears in the **report table** . If your Cloud Billing account is associated with a custom pricing contract and your [report settings](https://docs.cloud.google.com/billing/docs/how-to/reports/savings-and-credits#contract-pricing) result in the display of the *Negotiated savings* column, you will see a *List cost* column in your *CSV download* . Otherwise, if your report doesn't include a *Negotiated savings* column, you see a *Cost* column in your *CSV download*.
- [**Negotiated savings**](https://docs.cloud.google.com/billing/docs/how-to/reports/savings-and-credits#contract-pricing): If your Cloud Billing account is associated with a custom pricing contract, you'll see the *Negotiated savings* column.
- [**Savings programs**](https://docs.cloud.google.com/billing/docs/how-to/reports/savings-and-credits#savings_programs): Includes credits and discounts for your committed use discounts.
- [**Other savings**](https://docs.cloud.google.com/billing/docs/how-to/reports/savings-and-credits#other_savings): Includes promotional credits, sustained use discounts (SUDs), and other savings.
- **Unrounded subtotal**: The calculated cost of the usage to a precision of up to six decimal places, which can be helpful when analyzing your cost details and understanding the source of any discrepancies due to rounding.
- **Subtotal**: The calculated cost of the usage rounded to two decimal places.
- **Percent change in subtotal compared to previous period** : If your report table displays this column, then the percent change values are included in the CSV download. This column isn't included in the CSV download for reports using a multiple-dimension **Group by** option, such as **Date \> Service** or **Month \> Project**.
Each currency-column label includes a symbol for the currency of the
Cloud Billing account (for example, $ for USD or £ for GBP).
#### **Group by** setting
In addition to the charges and savings columns, the
[**Group by** option](https://docs.cloud.google.com/billing/docs/how-to/reports#group-by)
and the
[**Time range** settings](https://docs.cloud.google.com/billing/docs/how-to/reports#time-range)
affect which columns of data are downloaded, and the **Group by** option affects
the granularity of the report. The more granular the report, the more rows are
returned.
| *Group by* setting | Rows in report | Additional columns included in CSV download |
|---|---|---|
| Date-based **Group by** (for example, **Date \> Service**) | One row for each dimension, broken down by date. For example, if you choose **Date \> Project** , the CSV has one row for the daily costs of each project. When you select a date-based option, the CSV file doesn't include the **Percent change** column. | Date |
| Month-based **Group by** (for example, **Month \> Service**) | One row for each dimension, broken down by month. For example, if you choose **Month \> Project** , the CSV has one row for the monthly costs of each project. When you select a month-based option, the CSV doesn't include the **Percent change** column. | Month |
| Project | One row with costs summed per each *project*, with an additional row for costs not specific to a project. | Project name, Project ID, Project number |
| Project Hierarchy | One row with costs summed per each *project hierarchy*, with an additional row for costs not specific to a project, and a row for costs not included in a project hierarchy. | Project name, Project ID, Project number, Project hierarchy |
| Service | One row with costs summed per each service (such as Compute Engine, Cloud Run, App Engine). | Service description, Service ID |
| SKU | One row with usage and cost details for each SKU. This **Group by** setting returns the *most granular* details in the cost reports. | Service description, Service ID, SKU description, SKU ID, Usage amount, Usage unit |
| Subaccount | One row with costs summed per each billing account, including the parent account and its subaccounts. | Billing account name, Billing account ID |
| Location: Region or multiregion | One row with costs summed per each unique region where usage occurred, including a row for charges not specific to a location. | Region |
| Label keys | When grouping by label, you can select one **label key** at a time. The report returns one row for each unique label `key:value pair ` for the selected label key, and a row for charges for other usage. | Label |
### Additional notes about the CSV
- The [filters you set](https://docs.cloud.google.com/billing/docs/how-to/reports#filters)
customize the rows that are displayed in the table, and the data that is
downloaded to CSV.
- The costs and savings data in the report table is aggregated for the
specified
[time range](https://docs.cloud.google.com/billing/docs/how-to/reports#time-range).
- The report CSV has header information that includes the
Cloud Billing account name and the date range set on the report.
- The report CSV includes the footer details that appear below the report table.
The footer details might include invoice-level costs such as Tax and
Adjustments if you configured your report to
[show the invoice details](https://docs.cloud.google.com/billing/docs/how-to/reports/charges-on-invoices).
## Data availability
The data availability information in this section applies to customers who are
accessing a Cloud Billing account using
[billing-account-level permissions](https://docs.cloud.google.com/billing/docs/how-to/reports#required-permissions). If your access
to a billing account is limited to project-level permissions, you might not
be able to view all available cost data or report configuration options for a
Cloud Billing account.
- In Cloud Billing reports, usage cost data viewed by **Charge period** (formerly *Usage date*) is available back to January 2017 at the SKU level.
- Cost data viewed by **Billing period** (formerly *Invoice month*) is available back to May 2019 at the SKU level.
- Data at the sub-SKU level (for example, by resource ID) isn't available.
As of January 2017, the following data is included in Cloud Billing
reports:
- **SKU usage** : This is reported in the pricing units shown on the
[pricing table report](https://docs.cloud.google.com/billing/docs/how-to/pricing-table),
for example, *gibibyte month*.
- **SKU cost**: The SKU cost is based on the list price or custom contract
price for that usage, whichever price is applicable to your
Cloud Billing account. The cost is reported in the currency that
your Cloud Billing account is charged in.
- **Usage-specific savings** : This includes any
[credits or discounts](https://docs.cloud.google.com/billing/docs/how-to/reports/savings-and-credits)
that were applied directly to the SKU usage, such as sustained use
discounts, committed use discounts, or free trial and other promotional
credits that were applied.
- **Location data** : This includes costs incurred by
[region or multi-region](https://docs.cloud.google.com/docs/geography-and-regions).
As of May 2019, the following data is available in the
Cloud Billing reports:
- **Taxes** : Taxes that were applied to your invoices are reported by the
**Billing period** (formerly *Invoice month*) selected.
- **Account-level billing modifications** : Sum of credits or surcharges
applied at the account level due to Cloud Billing corrections
or contractual requirements. Reported as **Adjustments** when
viewing reports by **Billing period** (formerly *Invoice month* ). The month
that an adjustment is issued might differ from the month when the
adjustment is applied. For guidance on how to analyze adjustments, see
[Understand memos and adjustments](https://docs.cloud.google.com/billing/docs/how-to/resolve-issues#understand-memos).
- **Invoice details** : You can graph or group usage by **Billing period**
(formerly *Invoice month*). We don't display the invoice number in this
report view.
When viewing costs by **Billing period** (formerly *Invoice month*), the
following data is available in the Cloud Billing reports:
Invoices generally include all costs incurred during a given calendar
month (a billing period), but the cost for some services' usage at the very end
of a calendar month might roll over to the next month's invoice. As a result,
your invoice might include costs for more than one calendar month. Usage is
reported by *actual usage date* when viewing your
[invoice details](https://docs.cloud.google.com/billing/docs/how-to/cost-table)
and
[online reports](https://docs.cloud.google.com/billing/docs/how-to/reports/charges-on-invoices).
Other data specific to an invoice includes the totals of any taxes and
adjustments.
- For a detailed breakdown of the taxes on an invoice, [view the cost table report](https://docs.cloud.google.com/billing/docs/how-to/cost-table), or [view the details of your invoice](https://docs.cloud.google.com/billing/docs/how-to/get-invoice#invoiced-account).
- For guidance on understanding and analyzing any adjustments, see [Understand memos and adjustments](https://docs.cloud.google.com/billing/docs/how-to/resolve-issues#understand-memos).
As of May 2021, the following data is available in the
Cloud Billing reports:
- **Negotiated savings** : Viewable for Cloud Billing accounts that are
associated with a custom pricing contract, **Negotiated savings** shows
the difference in cost between your contract price compared to the
current list price. The **Negotiated savings** column is displayed when
viewing your report for a **Time range** that starts *after* May 1, 2021.
Prior to May 1, 2021, your costs are calculated using your custom
contract price, resulting in a single **Usage cost** column that includes
your negotiated savings in the cost calculations.
As of January 1, 2022, the following data is available in the
Cloud Billing reports:
- **Project hierarchy** : [Project hierarchy](https://docs.cloud.google.com/billing/docs/how-to/reports#group-by-project-hierarchy) is the project's ancestry, the resource hierarchy mapping of a project (Organization \> Folder \> Project). When viewing your report with a starting time range of January 1, 2022, you can group your data by project hierarchy.
- **Folders \& Organizations** : [Folders and organizations](https://docs.cloud.google.com/billing/docs/how-to/reports#filter-by-folders-orgs) are components of a project hierarchy. When viewing your report with a starting time range of January 1, 2022, you can filter your data by folders and organizations.
## FAQs
**How do I get access to the granular data behind Cloud Billing
reports?**
You can configure your Cloud Billing account to
[export data to BigQuery](https://docs.cloud.google.com/billing/docs/how-to/export-data-bigquery)
and then use BigQuery or your own tools to analyze the exported cost
line items. For example, from your BigQuery tables, you can choose to
[export your BigQuery data as CSV (or other formats) to a
Cloud Storage bucket](https://docs.cloud.google.com/bigquery/docs/exporting-data).
The Cloud Billing data exported to BigQuery
is the same data that your Cloud Billing reports use.
> [!NOTE]
> **Note:** The Cloud Billing data you export is only available starting when you enable export. To ensure you have a complete set of Cloud Billing data for your custom analysis needs, we recommend you [enable billing data export to BigQuery](https://docs.cloud.google.com/billing/docs/how-to/export-data-bigquery) when you first set up a Cloud Billing account.
**Can I save or share my Cloud Billing report view?**
Multiple options are available.
- **Save a report view** : You can save customized report views using the [Saved reports](https://docs.cloud.google.com/billing/docs/how-to/reports#saving-views) feature. Saved reports are available in the **All reports** page to anyone who has Cloud Billing account-level access to view billing reports.
- **Share a report** : You can [**Share**](https://docs.cloud.google.com/billing/docs/how-to/reports#share-report) a report by copying and sharing the URL of your customized Cloud Billing report.
- **Bookmark a report** : You can save a customized Cloud Billing
report view to be accessible in your browser by
[**bookmarking**](https://docs.cloud.google.com/billing/docs/how-to/reports#share-report)
the report URL. The URL includes the report settings you selected.
> [!NOTE]
> **Note:** As you configure your report by setting filters and groupings, your page URL updates to include your selections. It's possible that the URL length limit might be reached if you select many settings (for example, selecting 374 services out of 375). In these instances, the **Share** button is disabled and you see a notification on the reports page: *The URL
> may no longer reflect your selected filters, due to length limitations*.
- **Print a report** : You can
**Print** the
Cloud Billing report.
- **Download report CSV** : You can download the report data to a CSV file using
the
[**Download CSV**](https://docs.cloud.google.com/billing/docs/how-to/reports#download-to-csv)
selector at the top right of the summary table.
- **Create a custom report** : You can recreate the report using queries of your
[exported Cloud Billing data](https://docs.cloud.google.com/billing/docs/how-to/export-data-bigquery).
**How do I filter or group costs by zone, region, or multi-region?**
You can [group your costs](https://docs.cloud.google.com/billing/docs/how-to/reports#filtering_and_grouping)
by region or multi-region, and you can
[filter on locations](https://docs.cloud.google.com/billing/docs/how-to/reports#filtering_and_grouping)
(regions and multi-regions). The Cloud Billing reports don't
support filtering or grouping by
[zone](https://docs.cloud.google.com/docs/geography-and-regions#zonal_resources).
**Why are my *charge period* (formerly usage date) costs different than my
*billing period* (formerly invoice month) costs?**
Google Cloud and billing-eligible products such as Google Maps Platform,
Google AI Studio, and Firebase report usage data to
Cloud Billing at varying intervals. Due to the complexity of our
billing and processing systems, you might see a delay between your use of
services, the usage *charges* being applied to your Google payments
accounts, and the *usage and costs* being available to view in the various
cost reports and dashboards.
- Typically, your cost details are available within a day, but can sometimes take more than 24 hours.
- For self-serve, online accounts, it's possible that *charges* for some usage might occur rapidly, such as 5 to 15 minutes after usage.
- Because of this difference in timing, you might notice charges on your [Postpay or Prepay payments accounts](https://docs.cloud.google.com/billing/docs/how-to/billing-cycle#view_your_charging_cycle) occur before you can view the details of those charges in a cost report or billing dashboard. These system delays also impact budget alerts, anomaly detection, and billing data exported to BigQuery.
At the end of a calendar month,
late-reported usage might not be included on that month's invoice and instead
might roll over to the next month's invoice.
When you view your online reports, usage is shown by the actual usage date,
which might be different from the billing period's invoice month.
## Common report configuration scenarios
The following table lists common report configuration scenarios and
provides links to instructions for each task.
| ### View Gemini Enterprise costs in Cloud Billing reports ||
|---|---|
| Learn how to track, analyze, and manage your Gemini Enterprise subscription and consumption costs using billing reports. | [View Gemini Enterprise costs](https://docs.cloud.google.com/billing/docs/how-to/reports/gemini-enterprise-costs) |
| Learn how to access live costs in billing reports. Live costs are *gross, estimated* costs that are available in near-real-time for limited SKUs from eligible services and don't include credits. Live costs are faster than actual, fully processed costs and are useful for quick analysis. When spend caps or anomaly alerts are triggered, live costs can help you identify which specific SKUs, services, or projects are driving your costs. | [View live costs in reports](https://docs.cloud.google.com/billing/docs/how-to/reports/live-costs) |
| Use the Savings filters to include or exclude discounts and credits, such as committed use discounts and promotional credits, from your cost calculations. | [View and analyze your savings](https://docs.cloud.google.com/billing/docs/how-to/reports/savings-and-credits) |
| Configure the report to display costs by *Billing period* (formerly *Invoice month*) to include invoice-level charges like taxes and adjustments. If you receive more than one invoice for a month, the report view aggregates all invoice costs for the *Billing period* (the month that the invoices are issued). | [View the charges on your invoices](https://docs.cloud.google.com/billing/docs/how-to/reports/charges-on-invoices) |
| See how your costs are trending and how much you are projected to spend, up to 12 months in the future. | [View forecasted costs](https://docs.cloud.google.com/billing/docs/how-to/reports/forecasted-costs) |
| Group your costs by folders or organizations to analyze them by your organization's structure or cost centers. | [Analyze your costs by project hierarchy](https://docs.cloud.google.com/billing/docs/how-to/reports-project-hierarchy) |
| Open a cost report from an existing budget to view your budget scope and see the target amount plotted as a red line against actual costs. | [View a budget in your report](https://docs.cloud.google.com/billing/docs/how-to/reports/budget-in-reports) |
## Related topics
- [Export Cloud Billing data to BigQuery](https://docs.cloud.google.com/billing/docs/how-to/export-data-bigquery)
- [Understand your savings with cost breakdown reports](https://docs.cloud.google.com/billing/docs/how-to/cost-breakdown)
- [View your cost and payment history](https://docs.cloud.google.com/billing/docs/how-to/view-history)
- [Create, modify, or close your Cloud Billing account](https://docs.cloud.google.com/billing/docs/how-to/manage-billing-account)