# Visualize query results
You can use [visualization cells](https://docs.cloud.google.com/colab/docs/visualization-cells) in
Colab Enterprise notebooks to generate and customize charts and graphs
from your BigQuery data without writing Python code. Exploring
your query results visually within the notebook environment lets you
identify trends and analyze large-scale datasets without interrupting your
workflow.
In this tutorial, you use visualization cells in Colab Enterprise
notebooks to analyze data from the `bigquery-public-data.ml_datasets.penguins`
public dataset. You will complete the following tasks:
1. Execute SQL queries directly in a notebook.
2. Filter query results using Python DataFrames.
3. Generate and customize vertical bar charts without writing code.
## Before you begin
1.
[Verify that billing is enabled for your Google Cloud project](https://docs.cloud.google.com/billing/docs/how-to/verify-billing-enabled#confirm_billing_is_enabled_on_a_project).
2. Verify that the BigQuery API is enabled.
[Enable the API](https://console.cloud.google.com/apis/enableflow?apiid=bigquery)
If you created a new project, the BigQuery API is automatically
enabled.
### Required permissions
To create and run notebooks, you need the following Identity and Access Management (IAM)
roles:
- [BigQuery User (`roles/bigquery.user`)](https://docs.cloud.google.com/bigquery/docs/access-control#bigquery.user)
- [Colab Enterprise User (`roles/aiplatform.colabEnterpriseUser`)](https://docs.cloud.google.com/vertex-ai/docs/general/access-control#aiplatform.colabEnterpriseUser)
## Create a Colab Enterprise notebook
To create a new notebook, follow the instructions in [Create a notebook from the BigQuery editor](https://docs.cloud.google.com/bigquery/docs/create-notebooks#create-notebook-console).
## Run a SQL query in a Colab Enterprise notebook
To run a SQL query in a notebook, follow these steps:
1. In your notebook, click the **Code**
drop-down and select **Add SQL cell**.
2. Enter the following query:
SELECT * FROM `bigquery-public-data.ml_datasets.penguins`;
3. Click
**Run cell**.
The results of the query are automatically saved in a DataFrame called `df`.
4. Create another SQL cell and change the title to `female_penguins`.
5. Enter the following query, which references the DataFrame you just created
and filters the results to only include female penguins:
SELECT * FROM {df} WHERE sex = 'FEMALE';
6. Click
**Run cell**.
The results of the query are automatically saved in a DataFrame called
`female_penguins`.
## Visualize results in a Colab Enterprise notebook
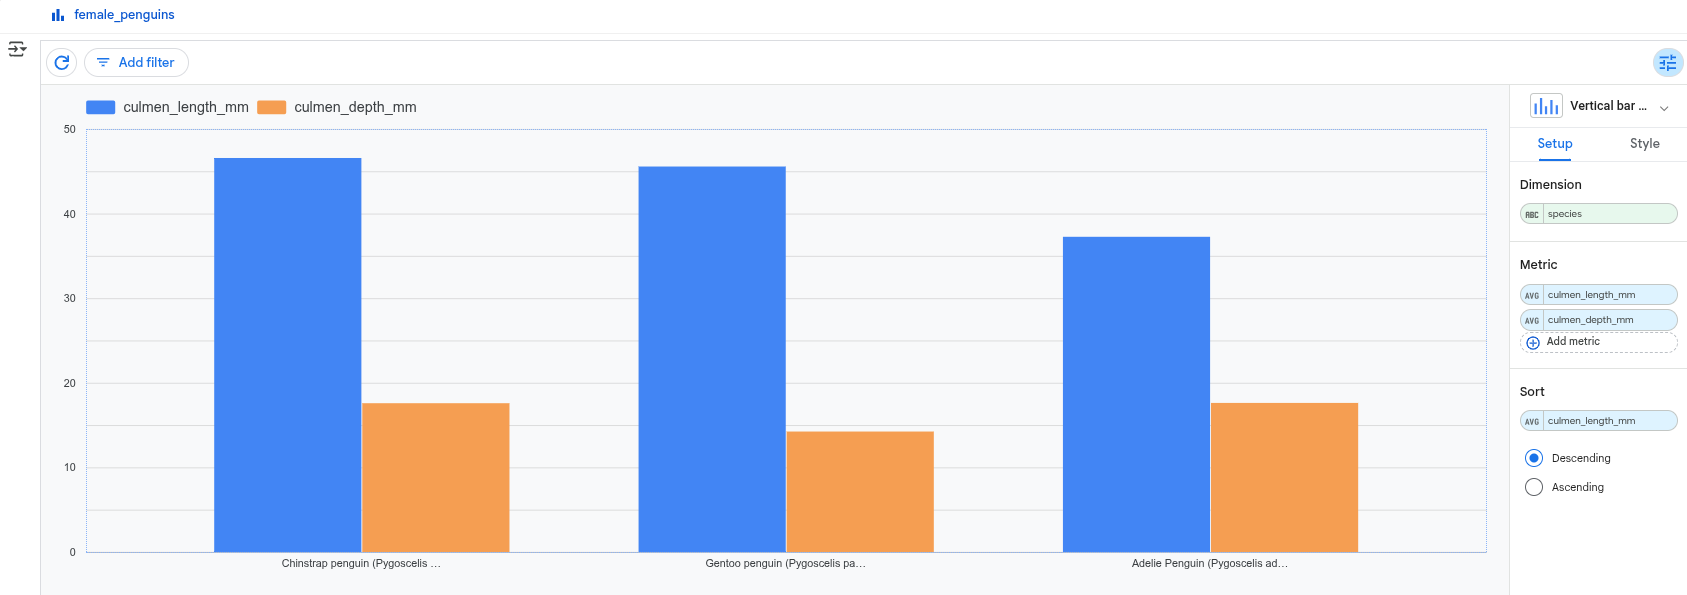
1. In your notebook, click the **Code**
drop-down and select **Add visualization cell**.
2. Click **Choose a dataframe** and then select `female_penguins`.
A chart interface appears.
3. Click **Scatter chart** to open a chart menu, then select the
**Vertical bar chart**.
4. In the **Metric** section, check that `culmen_length_mm` and
`culmen_depth_mm` appear. If a metric is missing, click
**Add metric**
and select it. To remove a metric, hold the pointer over the metric name
and then click **Close**.
5. Hold the pointer over the aggregation type (for example, **AVG** or **SUM** )
to reveal the icon, then click it to
change the aggregation type to **Average**.
## Clean up
The easiest way to eliminate billing is to delete the project that you
created for the tutorial.
To delete the project:
> [!CAUTION]
> **Caution** : Deleting a project has the following effects:
>
> - **Everything in the project is deleted.** If you used an existing project for the tasks in this document, when you delete it, you also delete any other work you've done in the project.
> - **Custom project IDs are lost.** When you created this project, you might have created a custom project ID that you want to use in the future. To preserve the URLs that use the project ID, such as an `appspot.com` URL, delete selected resources inside the project instead of deleting the whole project.
>
>
> If you plan to explore multiple architectures, tutorials, or quickstarts, reusing projects
> can help you avoid exceeding project quota limits.
1. In the Google Cloud console, go to the **Manage resources** page.
[Go to Manage resources](https://console.cloud.google.com/iam-admin/projects)
2. In the project list, select the project that you want to delete, and then click **Delete**.
3. In the dialog, type the project ID, and then click **Shut down** to delete the project.
## What's next
- Learn more about [BigQuery DataFrames](https://docs.cloud.google.com/bigquery/docs/bigquery-dataframes-introduction).
- Learn more about [SQL cells in Colab Enterprise](https://docs.cloud.google.com/colab/docs/sql-cells).
- Learn more about [visualization cells in Colab Enterprise](https://docs.cloud.google.com/colab/docs/visualization-cells).
- Learn how to [visualize graphs using BigQuery DataFrames](https://docs.cloud.google.com/bigquery/docs/dataframes-visualizations).
- Learn how to [use a BigQuery DataFrames notebook](https://github.com/googleapis/python-bigquery-dataframes/tree/main/notebooks/getting_started/getting_started_bq_dataframes.ipynb).