# Use raster data to analyze temperature
Performing geospatial analysis on [raster data](https://docs.cloud.google.com/bigquery/docs/raster-data) lets
you calculate and visualize
real-world climate metrics, such as the average temperature across different
countries. You can use the `ST_REGIONSTATS` function with Google Earth Engine
datasets to extract these regional insights and map your results
using BigQuery Geo Viz.
## Objectives
- Find publicly available Google Earth Engine data in BigQuery sharing (formerly Analytics Hub).
- Use the [`ST_REGIONSTATS` function](https://docs.cloud.google.com/bigquery/docs/reference/standard-sql/geography_functions#st_regionstats) to calculate the average temperature in each country at a point in time.
- Visualize your results in [BigQuery Geo Viz](https://docs.cloud.google.com/bigquery/docs/geospatial-visualize), which is a web tool for visualization of geospatial data in BigQuery using Google Maps APIs.
## Costs
In this tutorial, you use the following billable components of Google Cloud:
- [BigQuery](https://cloud.google.com/bigquery/pricing)
- [Google Earth Engine](https://cloud.google.com/earth-engine/pricing)
## Before you begin
We recommend that you create a Google Cloud project for this tutorial.
Make sure that you have the required roles to complete this tutorial.
### Set up a Google Cloud project
### Required roles
To get the permissions that
you need to perform the tasks in this tutorial,
ask your administrator to grant you the
following IAM roles on your project:
- [Earth Engine Resource Viewer](https://docs.cloud.google.com/iam/docs/roles-permissions/earthengine#earthengine.viewer) (`roles/earthengine.viewer`)
- [Service Usage Consumer](https://docs.cloud.google.com/iam/docs/roles-permissions/serviceusage#serviceusage.serviceUsageConsumer) (`roles/serviceusage.serviceUsageConsumer`)
- [BigQuery Data Editor](https://docs.cloud.google.com/iam/docs/roles-permissions/bigquery#bigquery.dataEditor) (`roles/bigquery.dataEditor`)
For more information about granting roles, see [Manage access to projects, folders, and organizations](https://docs.cloud.google.com/iam/docs/granting-changing-revoking-access).
These predefined roles contain
the permissions required to perform the tasks in this tutorial. To see the exact permissions that are
required, expand the **Required permissions** section:
#### Required permissions
The following permissions are required to perform the tasks in this tutorial:
- `earthengine.computations.create`
- `serviceusage.services.use`
- `bigquery.datasets.create`
You might also be able to get
these permissions
with [custom roles](https://docs.cloud.google.com/iam/docs/creating-custom-roles) or
other [predefined roles](https://docs.cloud.google.com/iam/docs/roles-overview#predefined).
## Subscribe to a dataset
To find the dataset used for this tutorial, follow these steps:
1. Go to the **Sharing (Analytics Hub)** page.
[Go to Sharing (Analytics Hub)](https://console.cloud.google.com/bigquery/analytics-hub)
2. Click **Search listings**.
3. In the **Search for listings** field, enter `"ERA5-Land Daily Aggregated"`.
4. Click the result. A details pane opens with information about the ERA5-Land
climate reanalysis dataset, including a description, a link to band
information, the availability, the pixel size, and the terms of use.
5. Click **Subscribe**.
6. Optional: Update the **Project**.
7. Update the **Linked dataset name** to `era5_climate_tutorial`.
8. Click **Save** . The linked dataset is added to your project and contains a
single table called `climate`.
## Find the raster ID
Each row in the `era5_climate_tutorial.climate` table contains metadata for a
raster image that has climate data for a particular day. Run the following query
to extract the raster ID of the raster image for January 1, 2025:
SELECT
assets.image.href
FROM
`era5_climate_tutorial.climate`
WHERE
properties.start_datetime = '2025-01-01';
The result is `ee://ECMWF/ERA5_LAND/DAILY_AGGR/20250101`. In the next section,
you use this for the `raster_id` argument to the `ST_REGIONSTATS` function.
## Compute the average temperature
Run the following query to compute the average temperature of each country
on January 1, 2025 using the
[`ST_REGIONSTATS` function](https://docs.cloud.google.com/bigquery/docs/reference/standard-sql/geography_functions#st_regionstats):
WITH SimplifiedCountries AS (
SELECT
ST_SIMPLIFY(geometry, 10000) AS simplified_geometry,
names.primary AS name
FROM
`bigquery-public-data.overture_maps.division_area`
WHERE
subtype = 'country'
)
SELECT
sc.simplified_geometry AS geometry,
sc.name,
ST_REGIONSTATS(
sc.simplified_geometry,
'ee://ECMWF/ERA5_LAND/DAILY_AGGR/20250101',
'temperature_2m'
).mean - 273.15 AS mean_temperature
FROM
SimplifiedCountries AS sc
ORDER BY
mean_temperature DESC;
This query runs on the publicly available `division_area` table that contains
`GEOGRAPHY` values representing the boundaries of various regions on Earth,
including countries. The `ST_REGIONSTATS` function uses the `temperature_2m`
band of the raster image, which contains the temperature of the air at 2 meters
above the surface of the land at the given pixel.
## Visualize the query results in BigQuery
To visualize your results in BigQuery, follow these steps:
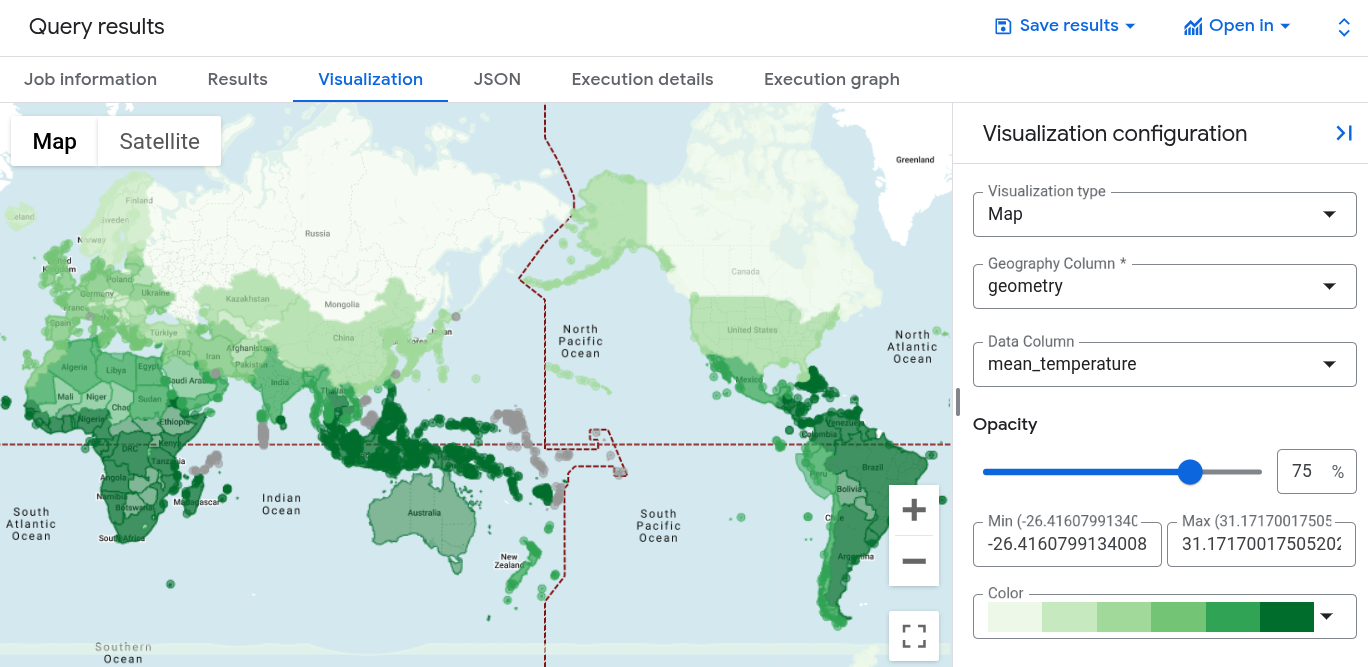
1. In the **Query results** pane, click the **Visualization** tab.
2. For **Data column** , select `mean_temperature`.
A world map appears, styled by a color gradient for the average temperature
of each country.
## Visualize the query results in Geo Viz
You can also visualize your results using BigQuery Geo Viz.
### Launch Geo Viz and authenticate
Before using Geo Viz, you must authenticate and grant access to data in
BigQuery.
To set up Geo Viz, do the following:
1. Open the Geo Viz web tool.
[Open Geo Viz](https://bigquerygeoviz.appspot.com/)
Alternatively, in the **Query results** pane, click
**Open in \> GeoViz**.
2. In step one, **Query** , click **Authorize**.
3. In the **Choose an account** dialog, click your Google Account.
4. In the access dialog, click **Allow** to give Geo Viz access to your
BigQuery data.
### Run your query in Geo Viz
After you authenticate and grant access, the next step is to run the query in
Geo Viz.
To run the query, do the following:
1. For step one, **Select data** , enter your project ID in the **Project ID**
field.
2. In the query window, enter the following GoogleSQL query. If you
opened Geo Viz from your query results, this field is already populated with
your query.
WITH SimplifiedCountries AS (
SELECT
ST_SIMPLIFY(geometry, 10000) AS simplified_geometry,
names.primary AS name
FROM
`bigquery-public-data.overture_maps.division_area`
WHERE
subtype = 'country'
)
SELECT
sc.simplified_geometry AS geometry,
sc.name,
ST_REGIONSTATS(
sc.simplified_geometry,
'ee://ECMWF/ERA5_LAND/DAILY_AGGR/20250101',
'temperature_2m'
).mean - 273.15 AS mean_temperature
FROM
SimplifiedCountries AS sc
ORDER BY
mean_temperature DESC;
3. Click **Run**.
### Apply styles
The **Style** section provides a list of visual styles for customization. For
more information about each style, see
[Format your visualization](https://docs.cloud.google.com/bigquery/docs/geospatial-get-started#format_your_visualization).
To format your map, do the following:
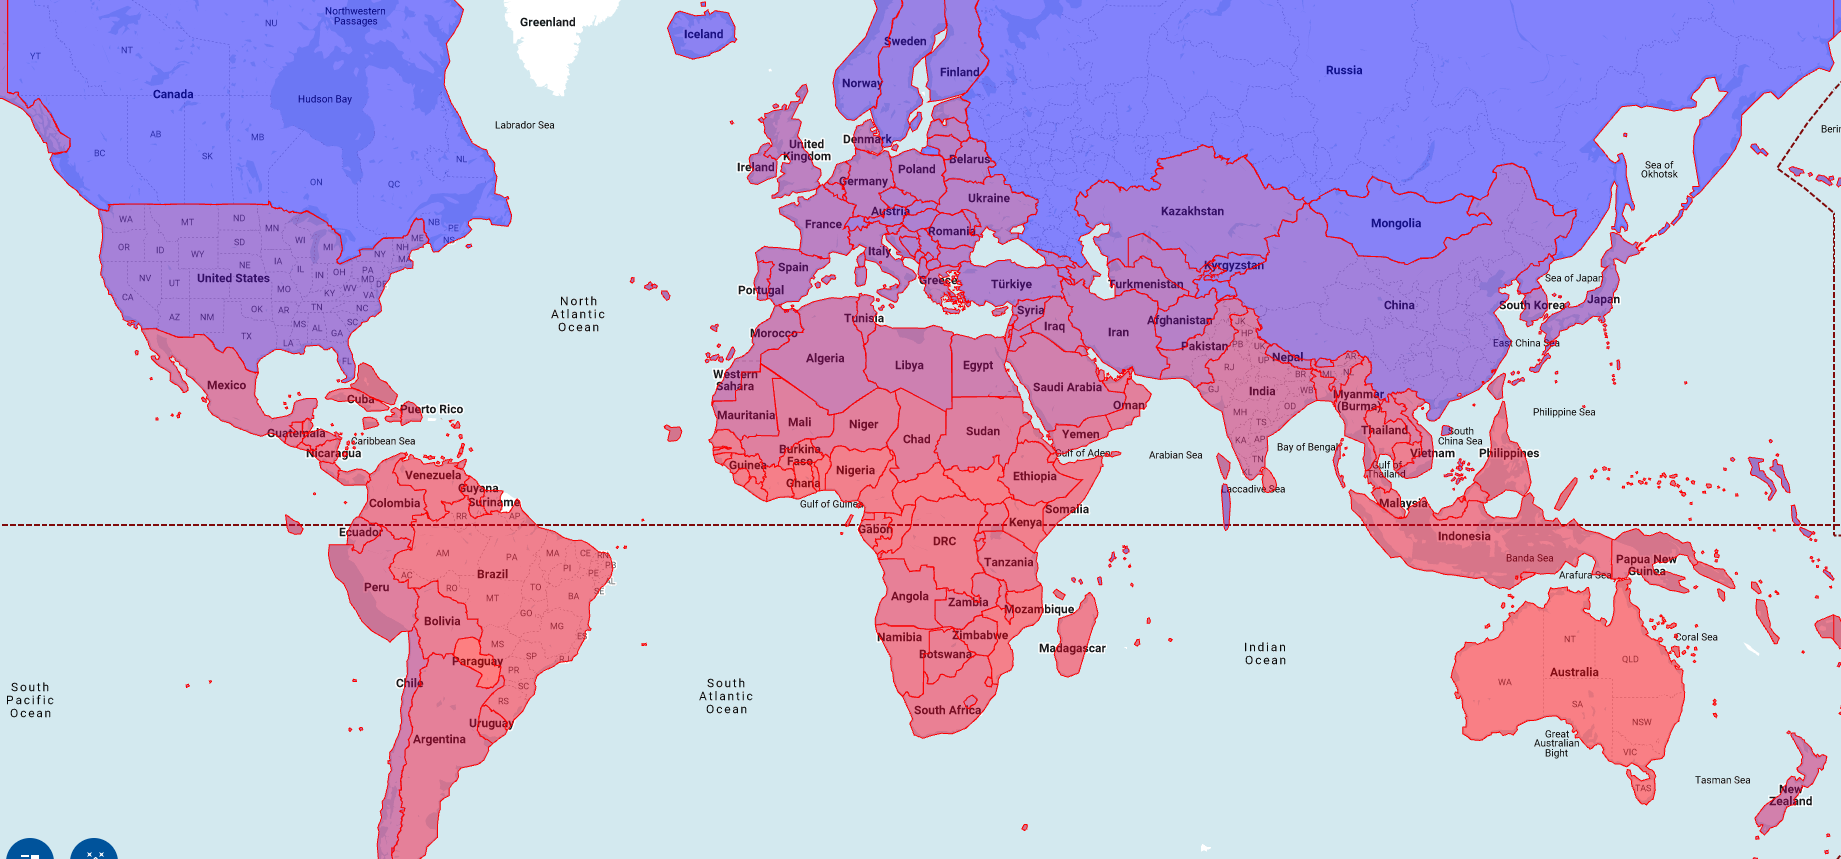
1. To open the **fillColor** panel, click step 3, **Style**.
2. Click the **Data-driven** toggle to the on position.
3. For **Function** , choose **linear**.
4. For **Field** , choose **`mean_temperature`**.
5. For **Domain** , enter `-20` in the first box and `32` in the second box.
6. For **Range** , click the first box and enter `#0006ff` in the **Hex**
box, and then click the second box and enter `#ff0000`. This changes the
color of each country based on its average temperature on January 1, 2025.
Blue indicates a colder temperature and red indicates a warmer temperature.
7. Click **fillOpacity**.
8. In the **Value** field, enter `.5`.
9. Click **Apply style**.
10. Examine your map. If you click a country, the country's name,
average temperature, and simplified geometry are displayed.
## Clean up
> [!CAUTION]
> **Caution** : Deleting a project has the following effects:
>
> - **Everything in the project is deleted.** If you used an existing project for the tasks in this document, when you delete it, you also delete any other work you've done in the project.
> - **Custom project IDs are lost.** When you created this project, you might have created a custom project ID that you want to use in the future. To preserve the URLs that use the project ID, such as an `appspot.com` URL, delete selected resources inside the project instead of deleting the whole project.
>
>
> If you plan to explore multiple architectures, tutorials, or quickstarts, reusing projects
> can help you avoid exceeding project quota limits.
1. In the Google Cloud console, go to the **Manage resources** page.
[Go to Manage resources](https://console.cloud.google.com/iam-admin/projects)
2. In the project list, select the project that you want to delete, and then click **Delete**.
3. In the dialog, type the project ID, and then click **Shut down** to delete the project.
## What's next
- To learn more about how to visualize options for geospatial analytics, see [Visualizing geospatial data](https://docs.cloud.google.com/bigquery/docs/geospatial-visualize).
- To work with raster data, see [Work with raster data](https://docs.cloud.google.com/bigquery/docs/raster-data).
- To learn more about the geography functions you can use in geospatial analytics, see [Geography functions in GoogleSQL](https://docs.cloud.google.com/bigquery/docs/reference/standard-sql/geography_functions).