This tutorial teaches you how to use a
[k-means model](https://docs.cloud.google.com/bigquery/docs/reference/standard-sql/bigqueryml-syntax-create-kmeans)
in BigQuery ML to identify clusters in a set of data.
The [k-means](https://en.wikipedia.org/wiki/K-means_clustering)
algorithm that groups your data into clusters is a form of unsupervised
machine learning. Unlike supervised machine learning, which is about predictive
analytics, unsupervised machine learning is about descriptive analytics.
Unsupervised machine learning can help you understand your data so that you can
make data-driven decisions.
The queries in this tutorial use
[geography functions](https://docs.cloud.google.com/bigquery/docs/reference/standard-sql/geography_functions)
available in geospatial analytics. For more information, see
[Introduction to geospatial analytics](https://docs.cloud.google.com/bigquery/docs/gis-intro).
This tutorial uses the
[London Bicycle Hires public dataset](https://console.cloud.google.com/marketplace/details/greater-london-authority/london-bicycles?filter=solution-type:dataset&id=95374cac-2834-4fa2-a71f-fc033ccb5ce4). The data
includes start and stop timestamps, station names, and ride duration.
## Objectives
This tutorial guides you through completing the following tasks:
- Examine the data used to train the model.
- Create a k-means clustering model.
- Interpret the data clusters produced, using BigQuery ML's visualization of the clusters.
- Run the [`ML.PREDICT` function](https://docs.cloud.google.com/bigquery/docs/reference/standard-sql/bigqueryml-syntax-predict) on the k-means model to predict the likely cluster for a set of bike hire stations.
## Costs
This tutorial uses billable components of Google Cloud, including the following:
- BigQuery
- BigQuery ML
For information on BigQuery costs, see the
[BigQuery pricing](https://cloud.google.com/bigquery/pricing) page.
For information on BigQuery ML costs, see
[BigQuery ML pricing](https://cloud.google.com/bigquery/pricing#bqml).
## Before you begin
1. BigQuery is automatically enabled in new projects. To activate BigQuery in a pre-existing project, go to
Enable the BigQuery API, if it is not already enabled.
**Roles required to enable APIs**
To enable APIs, you need the `serviceusage.services.enable` permission. If you
created the project, then you likely already have this permission through the
Owner role (`roles/owner`). Otherwise, you can get this permission through the
Service Usage Admin role (`roles/serviceusage.serviceUsageAdmin`).
[Learn how to grant roles](https://docs.cloud.google.com/iam/docs/granting-changing-revoking-access).
[Enable the API](https://console.cloud.google.com/apis/enableflow?apiid=bigquery)
## Required Permissions
- To create the dataset, you need the `bigquery.datasets.create`
IAM permission.
- To create the model, you need the following permissions:
- `bigquery.jobs.create`
- `bigquery.models.create`
- `bigquery.models.getData`
- `bigquery.models.updateData`
- To run inference, you need the following permissions:
- `bigquery.models.getData`
- `bigquery.jobs.create`
For more information about IAM roles and permissions in
BigQuery, see
[Introduction to IAM](https://docs.cloud.google.com/bigquery/docs/access-control).
## Create a dataset
Create a BigQuery dataset to store your k-means model:
1. In the Google Cloud console, go to the BigQuery page.
[Go to the BigQuery page](https://console.cloud.google.com/bigquery)
2. In the left pane, click **Explorer**:

If you don't see the left pane, click **Expand left pane** to open the pane.
3. In the **Explorer** pane, click your project name.
4. Click **View actions \> Create dataset**.

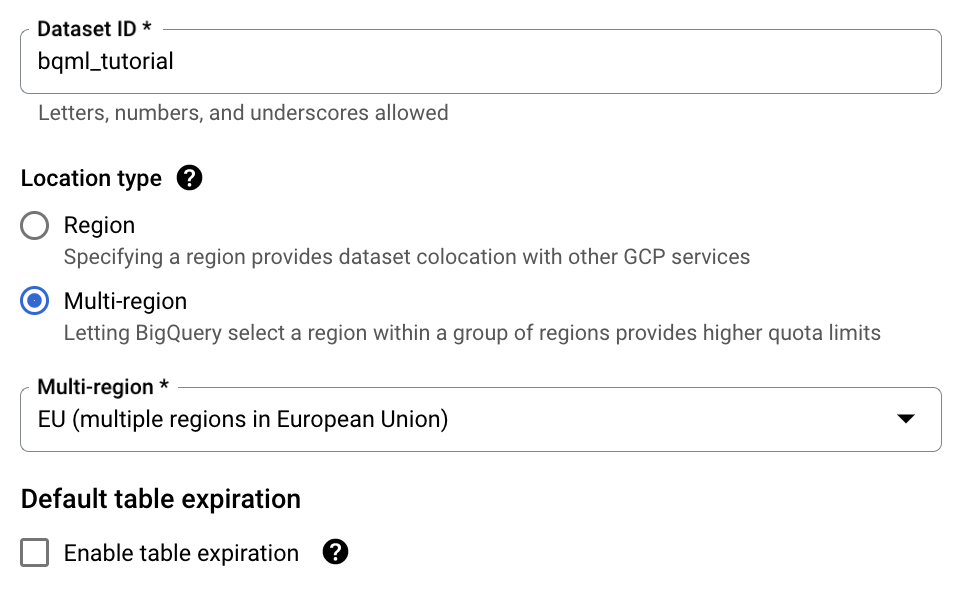
5. On the **Create dataset** page, do the following:
- For **Dataset ID** , enter `bqml_tutorial`.
- For **Location type** , select **Multi-region** , and then select
**EU (multiple regions in European Union)**.
The London Bicycle Hires public dataset is stored in the `EU`
[multi-region](https://docs.cloud.google.com/bigquery/docs/locations#multi-regions). Your dataset must
be in the same location.
- Leave the remaining default settings as they are, and click
**Create dataset**.
## Examine the training data
Examine the data you will use to train your k-means model. In this
tutorial, you cluster bike stations based on the following attributes:
- Duration of rentals
- Number of trips per day
- Distance from city center
### SQL
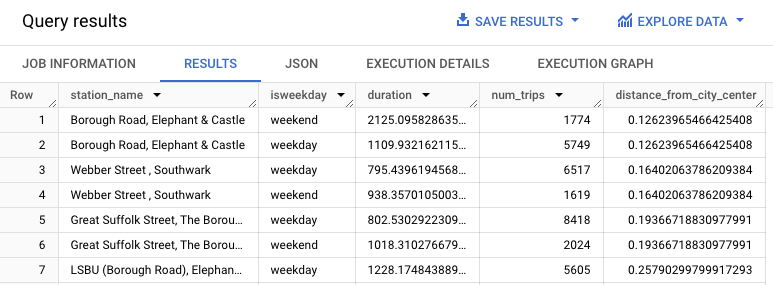
This query extracts data on cycle hires, including the `start_station_name`
and `duration` columns, and joins this data with station information. This
includes creating a calculated column that contains the station distance
from the city center. Then, it computes attributes of
the station in a `stationstats` column, including the average duration of
rides and the number of trips, and the calculated `distance_from_city_center`
column.
Follow these steps to examine the training data:
1. In the Google Cloud console, go to the **BigQuery** page.
[Go to BigQuery](https://console.cloud.google.com/bigquery)
2. In the query editor, paste in the following query and click **Run**:
```googlesql
WITH
hs AS (
SELECT
h.start_station_name AS station_name,
IF(
EXTRACT(DAYOFWEEK FROM h.start_date) = 1
OR EXTRACT(DAYOFWEEK FROM h.start_date) = 7,
'weekend',
'weekday') AS isweekday,
h.duration,
ST_DISTANCE(ST_GEOGPOINT(s.longitude, s.latitude), ST_GEOGPOINT(-0.1, 51.5)) / 1000
AS distance_from_city_center
FROM
`bigquery-public-data.london_bicycles.cycle_hire` AS h
JOIN
`bigquery-public-data.london_bicycles.cycle_stations` AS s
ON
h.start_station_id = s.id
WHERE
h.start_date
BETWEEN CAST('2015-01-01 00:00:00' AS TIMESTAMP)
AND CAST('2016-01-01 00:00:00' AS TIMESTAMP)
),
stationstats AS (
SELECT
station_name,
isweekday,
AVG(duration) AS duration,
COUNT(duration) AS num_trips,
MAX(distance_from_city_center) AS distance_from_city_center
FROM
hs
GROUP BY
station_name, isweekday
)
SELECT *
FROM
stationstats
ORDER BY
distance_from_city_center ASC;
```
The results should look similar to the following:
### BigQuery DataFrames
Before trying this sample, follow the BigQuery DataFrames
setup instructions in the [BigQuery quickstart
using BigQuery DataFrames](https://docs.cloud.google.com/bigquery/docs/dataframes-quickstart).
For more information, see the
[BigQuery DataFrames reference documentation](https://docs.cloud.google.com/python/docs/reference/bigframes/latest).
To authenticate to BigQuery, set up Application Default Credentials.
For more information, see [Set
up ADC for a local development environment](https://docs.cloud.google.com/docs/authentication/set-up-adc-local-dev-environment).
import datetime
import typing
import pandas as pd
from shapely.geometry import Point
import https://docs.cloud.google.com/python/docs/reference/bigframes/latest
import bigframes.bigquery as bbq
import bigframes.geopandas
import bigframes.pandas as bpd
https://docs.cloud.google.com/python/docs/reference/bigframes/latest.options.bigquery.project = your_gcp_project_id
# Compute in the EU multi-region to query the London bicycles dataset.
https://docs.cloud.google.com/python/docs/reference/bigframes/latest.options.bigquery.location = "EU"
# Set partial ordering mode for BigQuery DataFrames.
# For more information, see the BigQuery DataFrames performance documentation:
# https://cloud.google.com/bigquery/docs/dataframes-performance#partial-ordering-mode
bpd.options.bigquery.ordering_mode = "partial"
# Extract the information you'll need to train the k-means model in this
# tutorial. Use the read_gbq function to represent cycle hires
# data as a DataFrame.
h = bpd.https://docs.cloud.google.com/python/docs/reference/bigframes/latest/bigframes.pandas.html(
"bigquery-public-data.london_bicycles.cycle_hire",
col_order=["start_station_name", "start_station_id", "start_date", "duration"],
).rename(
columns={
"start_station_name": "station_name",
"start_station_id": "station_id",
}
)
# Use GeoSeries.from_xy and BigQuery.st_distance to analyze geographical
# data. These functions determine spatial relationships between
# geographical features.
cycle_stations = bpd.https://docs.cloud.google.com/python/docs/reference/bigframes/latest/bigframes.pandas.html("bigquery-public-data.london_bicycles.cycle_stations")
s = bpd.DataFrame(
{
"id": cycle_stations["id"],
"xy": https://docs.cloud.google.com/python/docs/reference/bigframes/latest.geopandas.GeoSeries.from_xy(
cycle_stations["longitude"], cycle_stations["latitude"]
),
}
)
s_distance = bbq.https://docs.cloud.google.com/python/docs/reference/bigframes/latest/bigframes.bigquery.html(s["xy"], Point(-0.1, 51.5), use_spheroid=False) / 1000
s = bpd.DataFrame({"id": s["id"], "distance_from_city_center": s_distance})
# Define Python datetime objects in the UTC timezone for range comparison,
# because BigQuery stores timestamp data in the UTC timezone.
sample_time = datetime.datetime(2015, 1, 1, 0, 0, 0, tzinfo=datetime.timezone.utc)
sample_time2 = datetime.datetime(2016, 1, 1, 0, 0, 0, tzinfo=datetime.timezone.utc)
h = h[(h["start_date"] >= sample_time) & (h["start_date"] <= sample_time2)]
# Replace each day-of-the-week number with the corresponding "weekday" or
# "weekend" label by using the Series.case_when method.
dayofweek = h["start_date"].dt.dayofweek
h = h.assign(
isweekday=dayofweek.case_when(
[
(dayofweek.isin([5, 6]), "weekend"),
(True, "weekday"),
]
)
)
# Supplement each trip in "h" with the station distance information from
# "s" by merging the two DataFrames by station ID.
merged_df = h.https://docs.cloud.google.com/python/docs/reference/bigframes/latest/bigframes.pandas.html(
right=s,
how="inner",
left_on="station_id",
right_on="id",
)
# Engineer features to cluster the stations. For each station, find the
# average trip duration, number of trips, and distance from city center.
stationstats = typing.cast(
bpd.DataFrame,
merged_df.groupby(["station_name", "isweekday"]).agg(
{"duration": ["mean", "count"], "distance_from_city_center": "max"}
),
)
stationstats.columns = pd.Index(
["duration", "num_trips", "distance_from_city_center"]
)
stationstats = stationstats.sort_values(
by="distance_from_city_center", ascending=True
).reset_index()
# Expected output results: >>> stationstats.head(3)
# station_name isweekday duration num_trips distance_from_city_center
# Borough Road... weekday 1110 5749 0.12624
# Borough Road... weekend 2125 1774 0.12624
# Webber Street... weekday 795 6517 0.164021
# 3 rows × 5 columns
## Create a k-means model
Create a k-means model using London Bicycle Hires training data.
### SQL
In the following query, the `CREATE MODEL` statement specifies the number of
clusters to use --- four. In the `SELECT` statement, the `EXCEPT` clause
excludes the `station_name` column because this column doesn't contain a
feature. The query creates a unique row per station_name, and only the
features are mentioned in the `SELECT` statement.
Follow these steps to create a k-means model:
1. In the Google Cloud console, go to the **BigQuery** page.
[Go to BigQuery](https://console.cloud.google.com/bigquery)
2. In the query editor, paste in the following query and click **Run**:
```googlesql
CREATE OR REPLACE MODEL `bqml_tutorial.london_station_clusters`
OPTIONS (
model_type = 'kmeans',
num_clusters = 4)
AS
WITH
hs AS (
SELECT
h.start_station_name AS station_name,
IF(
EXTRACT(DAYOFWEEK FROM h.start_date) = 1
OR EXTRACT(DAYOFWEEK FROM h.start_date) = 7,
'weekend',
'weekday') AS isweekday,
h.duration,
ST_DISTANCE(ST_GEOGPOINT(s.longitude, s.latitude), ST_GEOGPOINT(-0.1, 51.5)) / 1000
AS distance_from_city_center
FROM
`bigquery-public-data.london_bicycles.cycle_hire` AS h
JOIN
`bigquery-public-data.london_bicycles.cycle_stations` AS s
ON
h.start_station_id = s.id
WHERE
h.start_date
BETWEEN CAST('2015-01-01 00:00:00' AS TIMESTAMP)
AND CAST('2016-01-01 00:00:00' AS TIMESTAMP)
),
stationstats AS (
SELECT
station_name,
isweekday,
AVG(duration) AS duration,
COUNT(duration) AS num_trips,
MAX(distance_from_city_center) AS distance_from_city_center
FROM
hs
GROUP BY
station_name, isweekday
)
SELECT *
EXCEPT (station_name, isweekday)
FROM
stationstats;
```
### BigQuery DataFrames
Before trying this sample, follow the BigQuery DataFrames
setup instructions in the [BigQuery quickstart
using BigQuery DataFrames](https://docs.cloud.google.com/bigquery/docs/dataframes-quickstart).
For more information, see the
[BigQuery DataFrames reference documentation](https://docs.cloud.google.com/python/docs/reference/bigframes/latest).
To authenticate to BigQuery, set up Application Default Credentials.
For more information, see [Set
up ADC for a local development environment](https://docs.cloud.google.com/docs/authentication/set-up-adc-local-dev-environment).
from bigframes.bigquery import ml
# A k-means model groups data into clusters, which is useful for
# descriptive analytics.
#
# Extract only the numerical feature columns for model training.
# 'station_name' and 'isweekday' are excluded so clustering is based on
# bicycle usage patterns rather than station identity or day of week.
features = stationstats[["duration", "num_trips", "distance_from_city_center"]]
# Use ml.create_model to create and train the model in BigQuery.
# The options parameter specifies the model type and the number of clusters.
# For more information, see the BigQuery DataFrames API reference documentation:
# https://dataframes.bigquery.dev/reference/api/bigframes.bigquery.ml.create_model.html#bigframes.bigquery.ml.create_model
ml.https://docs.cloud.google.com/python/docs/reference/bigframes/latest/bigframes.bigquery.ml.html(
your_model_id, # For example: "bqml_tutorial.london_station_clusters",
options={
"model_type": "KMEANS",
"num_clusters": 4,
},
training_data=features,
replace=True,
)
## Interpret the data clusters
The information in the model's **Evaluation** tab can help you to interpret
the clusters produced by the model.
Follow these steps to view the model's evaluation information:
1. In the Google Cloud console, go to the **BigQuery** page.
[Go to BigQuery](https://console.cloud.google.com/bigquery)
2. In the left pane, click **Explorer**:

3. In the **Explorer** pane, expand your project and click **Datasets**.
4. Click the `bqml_tutorial` dataset, and then go to the **Models** tab.
5. Select the `london_station_clusters` model.
6. Select the **Evaluation** tab. This tab displays visualizations of the
clusters identified by the k-means model. In the **Numeric features**
section, bar graphs display the most important numeric feature values for
each centroid. Each centroid represents a given cluster of data. You can
select which features to visualize from the drop-down menu.

This model creates the following centroids:
- Centroid 1 shows a less busy city station, with shorter duration rentals.
- Centroid 2 shows the second city station which is less busy and used for longer duration rentals.
- Centroid 3 shows a busy city station that is close to the city center.
- Centroid 4 shows a suburban station with trips that are longer.
If you were running the bicycle hire business, you could use this information
to inform business decisions. For example:
- Assume that you need to experiment with a new type of lock. Which cluster of
stations should you choose as a subject for this experiment? The stations in
centroid 1, centroid 2 or centroid 4 seem like logical choices because they
are not the busiest stations.
- Assume that you want to stock some stations with racing bikes. Which stations
should you choose? Centroid 4 is the group of stations that are far from the
city center, and they have the longest trips. These are likely candidates for
racing bikes.
## Use the `ML.PREDICT` function to predict a station's cluster
Identify the cluster to which a particular station belongs by using the
`ML.PREDICT` SQL function or the
[`bigframes.bigquery.ml.predict` BigQuery DataFrames function](https://dataframes.bigquery.dev/reference/api/bigframes.bigquery.ml.predict.html#bigframes.bigquery.ml.predict).
### SQL
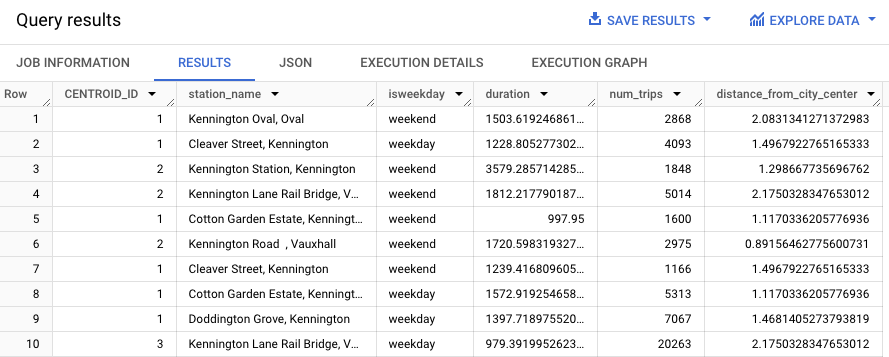
The following query uses the
[`REGEXP_CONTAINS`](https://docs.cloud.google.com/bigquery/docs/reference/standard-sql/string_functions#regexp_contains)
function to find all entries in the `station_name` column that contain the
string `Kennington`. The `ML.PREDICT` function uses those values to predict
which clusters might contain those stations.
Follow these steps to predict the cluster of every station that has
the string `Kennington` in its name:
1. In the Google Cloud console, go to the **BigQuery** page.
[Go to BigQuery](https://console.cloud.google.com/bigquery)
2. In the query editor, paste in the following query and click **Run**:
```googlesql
WITH
hs AS (
SELECT
h.start_station_name AS station_name,
IF(
EXTRACT(DAYOFWEEK FROM h.start_date) = 1
OR EXTRACT(DAYOFWEEK FROM h.start_date) = 7,
'weekend',
'weekday') AS isweekday,
h.duration,
ST_DISTANCE(ST_GEOGPOINT(s.longitude, s.latitude), ST_GEOGPOINT(-0.1, 51.5)) / 1000
AS distance_from_city_center
FROM
`bigquery-public-data.london_bicycles.cycle_hire` AS h
JOIN
`bigquery-public-data.london_bicycles.cycle_stations` AS s
ON
h.start_station_id = s.id
WHERE
h.start_date
BETWEEN CAST('2015-01-01 00:00:00' AS TIMESTAMP)
AND CAST('2016-01-01 00:00:00' AS TIMESTAMP)
),
stationstats AS (
SELECT
station_name,
isweekday,
AVG(duration) AS duration,
COUNT(duration) AS num_trips,
MAX(distance_from_city_center) AS distance_from_city_center
FROM
hs
GROUP BY
station_name, isweekday
)
SELECT *
EXCEPT (nearest_centroids_distance)
FROM
ML.PREDICT(
MODEL `bqml_tutorial.london_station_clusters`,
(
SELECT *
FROM
stationstats
WHERE
REGEXP_CONTAINS(station_name, 'Kennington')
));
```
The results should look similar to the following.
### BigQuery DataFrames
Before trying this sample, follow the BigQuery DataFrames
setup instructions in the [BigQuery quickstart
using BigQuery DataFrames](https://docs.cloud.google.com/bigquery/docs/dataframes-quickstart).
For more information, see the
[BigQuery DataFrames reference documentation](https://docs.cloud.google.com/python/docs/reference/bigframes/latest).
To authenticate to BigQuery, set up Application Default Credentials.
For more information, see [Set
up ADC for a local development environment](https://docs.cloud.google.com/docs/authentication/set-up-adc-local-dev-environment).
from bigframes.bigquery import ml
# Use 'contains' function to filter by stations containing the string
# "Kennington".
stationstats = stationstats[stationstats["station_name"].str.contains("Kennington")]
# Use the ml.predict method to predict results using your model.
# For more information, see the BigQuery DataFrames API reference documentation:
# https://dataframes.bigquery.dev/reference/api/bigframes.bigquery.ml.predict.html#bigframes.bigquery.ml.predict
ml.https://docs.cloud.google.com/python/docs/reference/bigframes/latest/bigframes.bigquery.ml.html(
your_model_id, # For example: "bqml_tutorial.london_station_clusters",
input_=stationstats,
)
# Expected output results:
# CENTROID... NEAREST... station_name isweekday duration num_trips dist...
# 1 [{'CENTROID_ID'... Borough... weekday 1110 5749 0.13
# 2 [{'CENTROID_ID'... Borough... weekend 2125 1774 0.13
# 1 [{'CENTROID_ID'... Webber... weekday 795 6517 0.16
# 3 rows × 7 columns
## Clean up
To avoid incurring charges to your Google Cloud account for the resources used in this
tutorial, either delete the project that contains the resources, or keep the project and
delete the individual resources.
- You can delete the project you created.
- Or you can keep the project and delete the dataset.
### Delete your dataset
Deleting your project removes all datasets and all tables in the project. If you
prefer to reuse the project, you can delete the dataset you created in this
tutorial:
1. If necessary, open the BigQuery page in the
Google Cloud console.
[Go to the BigQuery page](https://console.cloud.google.com/bigquery)
2. In the navigation, click the **bqml_tutorial** dataset you created.
3. Click **Delete dataset** on the right side of the window.
This action deletes the dataset and the model.
4. In the **Delete dataset** dialog, confirm the delete command by typing
the name of your dataset (`bqml_tutorial`) and then click **Delete**.
### Delete your project
To delete the project:
> [!CAUTION]
> **Caution** : Deleting a project has the following effects:
>
> - **Everything in the project is deleted.** If you used an existing project for the tasks in this document, when you delete it, you also delete any other work you've done in the project.
> - **Custom project IDs are lost.** When you created this project, you might have created a custom project ID that you want to use in the future. To preserve the URLs that use the project ID, such as an `appspot.com` URL, delete selected resources inside the project instead of deleting the whole project.
>
>
> If you plan to explore multiple architectures, tutorials, or quickstarts, reusing projects
> can help you avoid exceeding project quota limits.
1. In the Google Cloud console, go to the **Manage resources** page.
[Go to Manage resources](https://console.cloud.google.com/iam-admin/projects)
2. In the project list, select the project that you want to delete, and then click **Delete**.
3. In the dialog, type the project ID, and then click **Shut down** to delete the project.
## What's next
- For an overview of BigQuery ML, see [Introduction to BigQuery ML](https://docs.cloud.google.com/bigquery/docs/bqml-introduction).
- For information about creating models, see the [`CREATE MODEL`](https://docs.cloud.google.com/bigquery/docs/reference/standard-sql/bigqueryml-syntax-create) syntax page.