# Analyze with BigQuery data canvas
BigQuery data canvas lets you find, transform, query, and visualize your data
using natural language prompts and a graphical interface. You can interact with
this [Gemini in BigQuery](https://docs.cloud.google.com/bigquery/docs/gemini-overview)
feature to iterate on query results and explore multiple branches
of inquiry in a single place.
For analysis workflows, BigQuery data canvas uses a
[directed acyclic graph](https://en.wikipedia.org/wiki/Directed_acyclic_graph)
(DAG), which provides a graphical view of your workflow.
BigQuery data canvas is designed to accelerate analytics tasks and help
data professionals such as data analysts, data engineers, and others with their
data-to-insights journey. You don't need to have technical knowledge
of specific tools, only basic familiarity with reading and writing SQL.
BigQuery data canvas works with
[Knowledge Catalog](https://docs.cloud.google.com/knowledge-catalog/docs/introduction) metadata to identify
appropriate tables based on natural language.
Learn [how and when Gemini
for Google Cloud uses your data](https://docs.cloud.google.com/gemini/docs/discover/data-governance).
## Capabilities
BigQuery data canvas lets you do the following:
- Use [natural language search](https://docs.cloud.google.com/knowledge-catalog/docs/about-search) with
Knowledge Catalog metadata to find assets such as tables, views, or
materialized views.
- Use natural language for basic SQL queries such as the following:
- Queries that contain `FROM` clauses, math functions, arrays, and structs.
- `JOIN` operations for two tables.
- Create custom visualizations by using natural language to describe what you
want.
- Automate data insights.
## Limitations
- Natural language commands might not work well with the following:
- BigQuery ML
- Apache Spark
- Object tables
- BigLake
- `INFORMATION_SCHEMA` views
- JSON
- Nested and repeated fields
- Complex functions and data types such as `DATETIME` and `TIMEZONE`
- Data visualizations don't work with geomap charts.
- BigQuery data canvas isn't intended for direct use by business users.
## Prompting best practices
With the right prompting techniques, you can generate complex SQL queries. The
following suggestions help BigQuery data canvas refine your natural
language prompts to increase the accuracy of your queries:
- **Write with clarity.** State your request clearly and avoid being vague.
- **Ask direct questions.** For the most precise answer, ask one question at a
time, and keep your prompts concise. If you initially gave a prompt with more
than one question, itemize each distinct part of the question so that it's clear to
Gemini.
- **Give focused and explicit instructions.** Emphasize key terms in your
prompts.
- **Specify the order of operations.** Provide instructions in a clear and
ordered manner. Divide tasks into small, focused steps.
- **Refine and iterate.** Try different phrases and approaches to see what
yields the best results.
For more information, see
[Prompting best practices for BigQuery data canvas](https://cloud.google.com/blog/products/data-analytics/how-to-write-prompts-for-bigquery-data-canvas).
## Before you begin
1. [Ensure that Gemini in BigQuery is enabled for
your Google Cloud project.](https://docs.cloud.google.com/bigquery/docs/gemini-set-up) An administrator typically performs this step.
2. Ensure that you have the [necessary Identity and Access Management (IAM) permissions](https://docs.cloud.google.com/bigquery/docs/data-canvas#required-roles) to use BigQuery data canvas.
3. To manage data canvas metadata in Knowledge Catalog, ensure that the [Dataplex API](https://docs.cloud.google.com/knowledge-catalog/docs/enable-api) is enabled in your Google Cloud project.
### Required roles
To get the permissions that
you need to use BigQuery data canvas,
ask your administrator to grant you the
following IAM roles on the project:
- [BigQuery Studio User](https://docs.cloud.google.com/iam/docs/roles-permissions/bigquery#bigquery.studioUser) (`roles/bigquery.studioUser`)
- [Gemini for Google Cloud User](https://docs.cloud.google.com/iam/docs/roles-permissions/cloudaicompanion#cloudaicompanion.user) (`roles/cloudaicompanion.user`)
For more information about granting roles, see [Manage access to projects, folders, and organizations](https://docs.cloud.google.com/iam/docs/granting-changing-revoking-access).
You might also be able to get
the required permissions through [custom
roles](https://docs.cloud.google.com/iam/docs/creating-custom-roles) or other [predefined
roles](https://docs.cloud.google.com/iam/docs/roles-overview#predefined).
For more information about IAM roles and permissions in
BigQuery, see
[Introduction to IAM](https://docs.cloud.google.com/bigquery/docs/access-control).
To manage data canvas metadata in Knowledge Catalog,
ensure that you have the required
[Knowledge Catalog roles](https://docs.cloud.google.com/knowledge-catalog/docs/iam-roles) and the
[`dataform.repositories.get`](https://docs.cloud.google.com/dataform/docs/access-control#predefined-roles) permission.
> [!NOTE]
> **Note:** When you create a data canvas, BigQuery grants you the [Dataform Admin role](https://docs.cloud.google.com/dataform/docs/access-control#dataform.admin) (`roles/dataform.admin`) on that data canvas. All users with the Dataform Admin role granted on the Google Cloud project have owner access to all the data canvases created in the project. To override this behavior, see [Grant a specific role upon resource creation](https://docs.cloud.google.com/dataform/docs/access-control#grant-specific-role).
### Security considerations for data canvases
Because code assets in BigQuery are powered by Dataform, you should consider the following security implications for users with access to these assets:
- Visibility for code assets is governed by project-level Dataform permissions. Users with the `dataform.repositories.list` permission---which is included in standard BigQuery roles such as [BigQuery Job User](https://docs.cloud.google.com/bigquery/docs/access-control#bigquery.jobUser), [BigQuery Studio User](https://docs.cloud.google.com/bigquery/docs/access-control#bigquery.studioUser), and [BigQuery User](https://docs.cloud.google.com/bigquery/docs/access-control#bigquery.user)---can see all code assets in the **Explorer** panel of the Google Cloud project, regardless of whether they created these assets or these assets were shared with them. To restrict visibility, you can create [custom roles](https://docs.cloud.google.com/iam/docs/creating-custom-roles) that exclude the `dataform.repositories.list` permission.
- Any secrets shared with the Dataform service agent can potentially be accessed by users who can edit these assets. To secure your credentials, restrict creation and edit access to trusted users, and limit the secrets accessible to the Dataform service agent. For more information, see [Secrets access during package installation](https://docs.cloud.google.com/dataform/docs/access-control#secret-access-risk).
For more information, see [Security considerations for Dataform permissions](https://docs.cloud.google.com/dataform/docs/access-control#security-considerations-permissions).
## Node types
A canvas is a collection of one or more nodes. Nodes can be
connected in any order. BigQuery data canvas has the following node types:
- Text
- Search
- Table
- SQL
- Destination node
- Visualization
- Insights
### Text node
In BigQuery data canvas, a text node lets you add rich text content to your
canvas. It's useful for adding explanations, notes, or instructions to your
canvas, making it easier for you and others to understand the context and
purpose of your analysis. You can enter any text content you want into the text
node editor, including Markdown for formatting. This ability lets you create
visually appealing and informative text blocks.
From the text node, you can do the following:
- Delete the node.
- Debug the node.
- Duplicate the node.
### Search node
In BigQuery data canvas, a search node lets you find and incorporate data
assets into your canvas. It acts as a bridge between your natural language
queries or keyword searches and the actual data you want to work with.
You provide a search query, either with natural language or using keywords. The
search node searches through your data assets. It leverages Knowledge Catalog
metadata for enhanced context awareness. BigQuery data canvas also
suggests recently used tables, queries, and saved queries.
The search node returns a list of relevant data assets that match your query. It
factors in column names and table descriptions. You can then select the assets
you want to add to your data canvas as table nodes, where you can further
analyze and visualize the data.
From the search node, you can do the following:
- Delete the node.
- Debug the node.
- Duplicate the node.
### Table node
In BigQuery data canvas, a table node represents a specific table that
you've incorporated into your analysis workflow. It represents the data you're
working with and lets you interact with it directly.
A table node displays information about the table, such as its name, schema, and
a preview of the data. You can interact with the table by viewing details such
as the table schema, table details, and a table preview.
From the table node, you can do the following:
- Delete the node.
- Debug the node.
- Duplicate the node.
- Run the node.
- Run the node and the following node.
Within the data canvas, you can do the following:
- Query the results in a new SQL node.
- Join the results to another table.
### SQL node
In BigQuery data canvas, a SQL node lets you execute custom SQL queries
directly within your canvas. You can either write SQL code directly in the SQL
node editor or use a natural language prompt to generate the SQL.
The SQL node executes the provided SQL query against the specified data sources.
The SQL node produces a result table, which can then be connected to other nodes
in the canvas for further analysis or visualization. The outputs from the
execution of a SQL node, known as the *query result* , can also be persisted to
their own table through a *destination node*.
After the query has run, you can export it as a [scheduled
query](https://docs.cloud.google.com/bigquery/docs/scheduling-queries), [export the query
results](https://docs.cloud.google.com/bigquery/docs/export-file), or
[share](https://docs.cloud.google.com/bigquery/docs/work-with-saved-queries#share-saved-query) the canvas,
similar to [running an interactive
query](https://docs.cloud.google.com/bigquery/docs/running-queries#queries).
From the SQL node, you can do the following:
- Export the SQL statement as a scheduled query.
- Delete the node.
- Debug the node.
- Duplicate the node.
- Run the node.
- Run the node and the following node.
Within the data canvas, you can do the following:
- Query the results in a new SQL node.
- Save the results to a table.
- Visualize the results in a visualization node.
- Generate insights on the results in an insights node.
- Join the results to another table.
### Destination node
In BigQuery data canvas, a destination node is a child of a SQL node that
persists the result of a SQL execution to a dedicated table. You
can save the table in a new or existing dataset, or as a new or existing table
in a dataset. After a destination table is created, use the SQL toggle button to
keep the table updated in real time when the parent SQL node is re-executed.
A destination node can become a table node when it's detached from its parent
and the content of the table isn't affected by any upstream changes at the
parent SQL node.
From the destination node, you can do the following:
- Detach the node from the parent to make it a standalone table node.
- Query the table in a new SQL node.
- Join the results to another table.
### Visualization node
In BigQuery data canvas, a visualization node lets you display data
visually, making it easier to understand trends, patterns, and insights. It
provides a variety of chart types to choose from, letting you select and
customize the best visualization for your data.
A visualization node takes a table as input, which can be the result of a SQL
query or a table node. Based on the selected chart type and the data in the
input table, the visualization node generates a chart. You can select
**Auto-Chart** to let BigQuery select the best chart type for
your data. The visualization node then displays the generated chart.
The visualization node lets you customize your chart, including changing the
colors, labels, and data sources. You can also export the chart as a PNG file.
Visualize data by using the following graphic types:
- Bar chart
- Heat map
- Line graph
- Pie chart
- Scatter chart
From the visualization node, you can do the following:
- Export the chart as a PNG file.
- Debug the node.
- Duplicate the node.
- Run the node.
- Run the node and the following node.
Within the data canvas, you can do the following:
- Generate insights on the results in an insights node.
- Edit the visualization.
### Insights node
In BigQuery data canvas, an insights node lets you generate insights and
summaries from the data within your data canvas. This helps you uncover
patterns, assess data quality, and perform statistical analysis on your canvas.
It identifies trends, patterns, anomalies, and correlations within your data, as
well as generates concise and clear summaries of the data analysis
results.
For more information about data insights, see [Generate data insights in
BigQuery](https://docs.cloud.google.com/bigquery/docs/data-insights).
From the insights node, you can do the following:
- Delete the node.
- Duplicate the node.
- Run the node.
## Use BigQuery data canvas
You can use BigQuery data canvas in the Google Cloud console, a query, or
a table.
1. Go to the **BigQuery** page.
[Go to BigQuery](https://console.cloud.google.com/bigquery)
2. In the query editor, next to
**SQL query** , click
**Create new** , select **AI and knowledge** , and then click **Data canvas**.

3. In the **Natural language** prompt field, enter a natural language prompt.
For example, if you enter `Find me tables related to trees`,
BigQuery data canvas returns a list of possible tables, including
public datasets like `bigquery-public-data.usfs_fia.plot_tree` or
`bigquery-public-data.new_york_trees.tree_species`.
4. Select a table.
A table node for the selected table is added to BigQuery data canvas.
To view schema information, view table details, or preview the data, select
the various tabs in the table node.
5. Optional: After you save the data canvas, use the following toolbar to view
data canvas details or the
[version history](https://docs.cloud.google.com/bigquery/docs/data-canvas#view_and_compare_data_canvas_versions), add new comments,
or reply to or get a link to an existing comment:
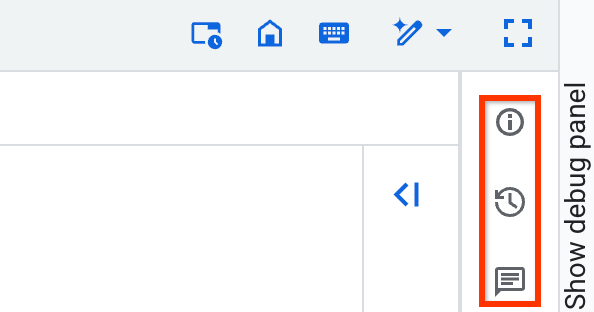
The **Comments** toolbar feature is in
[Preview](https://cloud.google.com/products#product-launch-stages). To
provide feedback or request support for this feature, send an email to
[bqui-workspace-pod@google.com](mailto:bqui-workspace-pod@google.com).
### Canvas controls
The data canvas toolbar provides the following controls for adding nodes and
managing the canvas view:
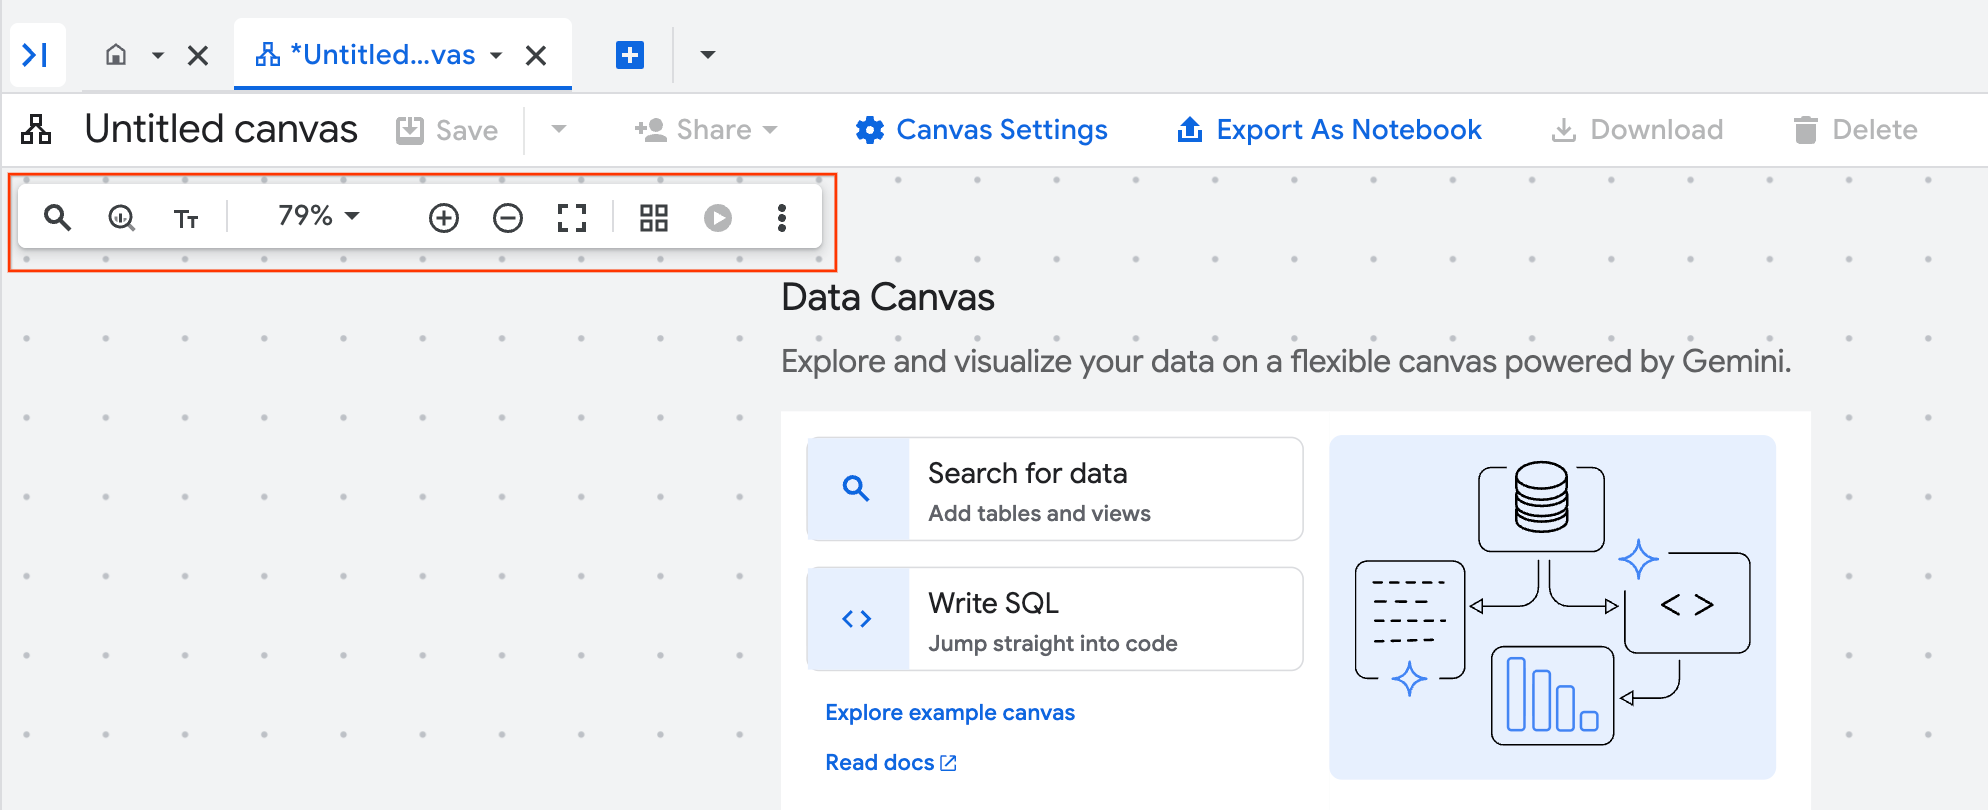
- **Search**: Adds a search node to the canvas.
- **SQL**: Adds a SQL node to the canvas.
- **Text**: Adds a Markdown or text node for comments.
- **Zoom controls**: Let you set a specific zoom level.
- **Zoom to Fit**: Automatically adjusts the zoom to show all content on the canvas.
- **Zoom to Selection**: Automatically adjusts the zoom to focus on the selected node.
- **Zoom In** : Magnifies the view of the canvas. You can also zoom in by holding Control and using the mouse wheel to scroll.
- **Zoom Out** : Reduces the view of the canvas. You can also zoom out by holding Control and using the mouse wheel to scroll.
- **Full screen**: Enters full-screen mode for the canvas.
- **Tidy canvas**: Automatically arranges the nodes on your canvas.
- **Refresh canvas**: Runs all executable nodes with a single button.
- **More actions**: Opens additional options, such as clearing the canvas.
The following examples demonstrate different ways to use
BigQuery data canvas in analysis workflows.
### Canvas settings
The **Canvas settings** pane provides the following options:
- **Location** : the processing [location](https://docs.cloud.google.com/bigquery/docs/data-canvas#supported-locations) for your data canvas. For details, see [Specify locations](https://docs.cloud.google.com/bigquery/docs/locations#specify_locations).
- **Query parameters** : add [parameters](https://docs.cloud.google.com/bigquery/docs/parameterized-queries) to use in SQL queries for your data canvas.
- **Resource management** : manage [query job priority](https://docs.cloud.google.com/bigquery/docs/running-queries#interactive-batch), [caching](https://docs.cloud.google.com/bigquery/docs/cached-results), and [job settings](https://docs.cloud.google.com/bigquery/docs/default-configuration#query_and_job_execution_settings).
- **Canvas management**: control the display of query output on your data canvas.
- **Advanced options** : select a Google-owned and Google-managed encryption key or [Customer-managed encryption key (CMEK)](https://docs.cloud.google.com/kms/docs/cmek), and set the [maximum bytes billed](https://docs.cloud.google.com/bigquery/docs/best-practices-costs#restrict-bytes-billed) for your queries.
To change the settings for your data canvas, follow these steps:
1. Go to the **BigQuery** page.
[Go to BigQuery](https://console.cloud.google.com/bigquery)
2. In the left pane, click
**Explorer**.
3. Expand your project name, and then click **Data canvases**.
4. On the **Data canvases** page, click the link for the canvas you want to
update.
5. Click
**Canvas settings**.
6. In the **Location** section, choose from the following options:
1. Select **Automatic location selection** to allow BigQuery
to automatically determine the processing location based on the
resources you're querying.
2. Alternatively, to manually route your jobs, do the following:
1. Deselect **Automatic location selection** and then select a
**Location type** , either **Region** or **Multi-region**.
2. In the region field, specify the region, or in the multi-region
field, specify the multi-region.
3. Optionally, for **Reservation**, choose a reservation to use for the
canvas jobs.
7. In the **Query parameters** section, choose from the following options:
1. Click add **Add parameter** to define standard parameters to use across
the SQL queries in your canvas.
2. Enter a name, type, and value for the parameter.
> [!NOTE]
> **Note:** Query parameters in the Google Cloud console only support primitive types. For complex types such as `ARRAY`, `STRUCT`, and `JSON`, use the `bq` command-line tool or the BigQuery API.
8. In the **Resource management** section, choose from the following options:
1. For **Job priority** , choose whether to run your canvas queries using
**Interactive** or **Batch** priority.
2. For **Cache preference** , select **Use cached results** to allow
BigQuery to return previously cached query results. Using
cached results can reduce costs and improve performance.
3. For **Job timeout**, enter a maximum job execution time in milliseconds.
If this time limit is exceeded, BigQuery attempts to stop
the job.
9. In the **Canvas management** section, deselect **Omit node output when
saving this canvas** to cache the query results with the canvas state. This
only saves the canvas structure and queries.
10. Expand the **Advanced options** section, and choose from the following
options:
1. For **Encryption** , choose **Google-managed keys** or choose
**Cloud KMS key**, and enter your customer-managed key type and value.
2. For **Maximum bytes billed**, enter a limit on bytes billed for your
queries. If a query goes beyond this limit, it fails without incurring
charges. If this option isn't specified, the maximum bytes billed is set
to the project default.
11. After making your changes, click **Save** to apply the settings to your data
canvas.
### Example workflow: Find, query, and visualize data
In this example, you use natural language prompts in BigQuery data canvas
to find data, generate a query, and edit the query. Then, you create a chart.
#### Prompt 1: Find data
1. In the Google Cloud console, go the **BigQuery** page.
[Go to BigQuery](https://console.cloud.google.com/bigquery)
2. In the query editor, next to
**SQL query** , click
**Create new** , select **AI and knowledge** , and then click **Data canvas**.

3. Click **Search for data**.
4. Click filter_list **Edit search
filters** , and then, in the **Filter search** pane, click the **BigQuery
public datasets** toggle to the on position.
5. In the **Natural language** prompt field, enter the following natural language prompt:
Chicago taxi trips
BigQuery data canvas generates a list of potential tables based on
Knowledge Catalog metadata. You can select multiple tables.
6. Select `bigquery-public-data.chicago_taxi_trips.taxi_trips` table, and then
click **Add to canvas**.
A table node for `taxi_trips` is added to BigQuery data canvas. To
view schema information, view table details, or preview the data, select
the various tabs in the table node.
#### Prompt 2: Generate a SQL query in the selected table
> [!CAUTION]
> As an early-stage technology, Gemini for Google Cloud
> products can generate output that seems plausible but is factually incorrect. We recommend that you
> validate all output from Gemini for Google Cloud products before you use it.
> For more information, see
> [Gemini for Google Cloud and responsible AI](https://docs.cloud.google.com/gemini/docs/discover/responsible-ai).
To generate a SQL query for the
`bigquery-public-data.chicago_taxi_trips.taxi_trips` table, do the following:
1. In the data canvas, click **Query**.
2. In the **Natural language** prompt field, enter the following:
Get me the 100 longest trips
BigQuery data canvas generates a SQL query similar to the following:
```googlesql
SELECT
taxi_id,
trip_start_timestamp,
trip_end_timestamp,
trip_miles
FROM
`bigquery-public-data.chicago_taxi_trips.taxi_trips`
ORDER BY
trip_miles DESC
LIMIT
100;
```
#### Prompt 3: Edit the query
To edit the query that you generated, you can manually edit the query, or you
can change the natural language prompt and regenerate the query. In this
example, you use a natural language prompt to edit the query to select only
trips where the customer paid with cash.
1. In the **Natural language** prompt field, enter the following:
Get me the 100 longest trips where the payment type is cash
BigQuery data canvas generates a SQL query similar to the following:
```googlesql
SELECT
taxi_id,
trip_start_timestamp,
trip_end_timestamp,
trip_miles
FROM
`PROJECT_ID.chicago_taxi_trips_123123.taxi_trips`
WHERE
payment_type = 'Cash'
ORDER BY
trip_miles DESC
LIMIT
100;
```
In the preceding example, `PROJECT_ID` is the ID of
your Google Cloud project.
2. To view the results of the query, click **Run**.
#### Create a chart
1. In the data canvas, click **Visualize**.
2. Click **Create bar chart**.
BigQuery data canvas creates a bar chart showing the most trip miles
by trip ID. Along with providing a chart, BigQuery data canvas
summarizes some of the key details of the data backing the visualization.
3. Optional: Do one or more of the following:
- To modify the chart, click **Edit** , and then edit the chart in the **Edit visualization** pane.
- To share the data canvas, click **Share** , then click **Share Link** to copy BigQuery data canvas link.
- To clean up the data canvas, select **More actions** , and then select **Clear canvas**. This step results in a blank canvas.
### Example workflow: Join tables
In this example, you use natural language prompts in
BigQuery data canvas to find data and join tables. Then, you export a
query as a notebook.
#### Prompt 1: Find data
1. In the **Natural language** prompt field, enter the following prompt:
Information about trees
BigQuery data canvas suggests several tables that have information
about trees.
2. For this example, select the
`bigquery-public-data.new_york_trees.tree_census_1995` table, and then click
**Add to canvas**.
The table is displayed on the canvas.
#### Prompt 2: Join the tables on their address
1. On the data canvas, click
**Join**.
BigQuery data canvas suggests tables to join.
2. To open a new **Natural language** prompt field, click **Search for
tables**.
3. In the **Natural language** prompt field, enter the following prompt:
Information about trees
4. Select the `bigquery-public-data.new_york_trees.tree_census_2005` table, and
then click **Add to canvas**.
The table is displayed on the canvas.
5. On the data canvas, click
**Join**.
6. In the **On this canvas** section, select the **Table cell** checkbox, and
then click **OK**.
7. In the **Natural language** prompt field, enter the following prompt:
Join on address
BigQuery data canvas suggests the SQL query to join these two tables
on their address:
```googlesql
SELECT
*
FROM
`bigquery-public-data.new_york_trees.tree_census_2015` AS t2015
JOIN
`bigquery-public-data.new_york_trees.tree_census_1995` AS t1995
ON
t2015.address = t1995.address;
```
8. To run the query and view the results, click **Run**.
#### Export query as a notebook
BigQuery data canvas lets you export your queries as a notebook.
1. In the data canvas, click **Export as notebook**.
2. In the **Save Notebook** pane, enter the name for the notebook and the region where you want to save it.
3. Click **Save**. The notebook is created successfully.
4. Optional: To view the created notebook, click **Open**.
### Example workflow: Edit a chart by using a prompt
In this example, you use natural language prompts in BigQuery data canvas
to find, query, and filter data, and then edit visualization details.
#### Prompt 1: Find data
1. To find data about US names, enter the following prompt:
Find data about USA names
BigQuery data canvas generates a list of tables.
2. For this example, select the
`bigquery-public-data.usa_names.usa_1910_current` table, and then
click **Add to canvas**.
#### Prompt 2: Query the data
1. To query the data, in the data canvas, click **Query**, and then
enter the following prompt:
Summarize this data
BigQuery data canvas generates a query similar to the following:
```googlesql
SELECT
state,
gender,
year,
name,
number
FROM
`bigquery-public-data.usa_names.usa_1910_current`
```
2. Click **Run**. The query results are displayed.
#### Prompt 3: Filter the data
1. In the data canvas, click **Query these results**.
2. To filter the data, in the **SQL** prompt field, enter the following
prompt:
Get me the top 10 most popular names in 1980
BigQuery data canvas generates a query similar to the following:
```googlesql
SELECT
name,
SUM(number) AS total_count
FROM
`bigquery-public-data`.usa_names.usa_1910_current
WHERE
year = 1980
GROUP BY
name
ORDER BY
total_count DESC
LIMIT
10;
```
When you run the query, you get a table with the ten most common names of
children born in 1980.
#### Create and edit a chart
1. In the data canvas, click **Visualize**.
BigQuery data canvas suggests several visualization options, including
a bar chart, pie chart, line graph, and custom visualization.
2. For this example, click **Create bar chart**.
BigQuery data canvas creates a bar chart similar to the following:

Along with providing a chart, BigQuery data canvas summarizes some of the key details
of the data backing the visualization. You can modify the chart by clicking
**Visualization details** and editing your chart in the side panel.
#### Prompt 4: Edit visualization details
1. In the **Visualization** prompt field, enter the following:
Create a bar chart sorted high to low, with a gradient
BigQuery data canvas creates a bar chart similar to the following:

2. Optional: To make further changes, click **Edit**.
The **Edit visualization** pane is displayed. You can edit details
such as the chart title, x-axis name, and y-axis name. Also, if
you click the **JSON Editor** tab, you can directly edit the chart
based on the JSON values.
## Work with a Gemini assistant
> [!WARNING]
>
> **Preview**
>
>
> This product or feature is
>
> subject to the "Pre-GA Offerings Terms" in the General Service Terms section
> of the [Service Specific
> Terms](https://docs.cloud.google.com/terms/service-terms#1).
>
> Pre-GA products and features are available "as is" and might have limited support.
>
> For more information, see the
> [launch stage descriptions](https://cloud.google.com/products/#product-launch-stages).
> [!NOTE]
> **Note:** To provide feedback or request support for this feature, send an email to [datacanvas-feedback@google.com](mailto:datacanvas-feedback@google.com).
You can use a Gemini-powered chat experience to work with
BigQuery data canvas. The chat assistant can create nodes based on your
requests, run queries, and create visualizations. You can choose tables for the
assistant to work with, and you can add instructions to the assistant to direct
its behavior. The assistant works with new or existing data canvases.
To work with the Gemini assistant, do the following:
1. To open the assistant, on the data canvas, click spark **Open Data Canvas Assistant**.
2. In the **Ask a data question** field, enter a natural language
prompt---for example, one of the following:
- `Show me interesting statistics of my data.`
- `Make a chart based on my data, sorted high to low.`
- `I want to see sample data from my table.`
The response includes a node or nodes based on the request. For example,
if you ask the assistant to create a chart of your data, it creates a
visualization node on the data canvas.
When you click the **Ask a data question** field, you can also
do the following:
- To add data, click **Settings**.
- To add instructions, click **Settings**.
3. To continue working with the assistant, add additional natural language
prompts.
You can continue to make natural language prompts as you work with your data
canvas.
### Add data
When you work with the Gemini chat interface, you can add data so
that the assistant knows which dataset to reference. The assistant asks you to
select a table before you run any prompts. When you search for data within the
assistant, you can limit the scope of the searchable data to all projects,
starred projects, or your current project. You can also decide whether to
include public datasets in your search.
To add data to the Gemini assistant, do the following:
1. To open the assistant, on the data canvas, click spark **Open Data Canvas Assistant**.
2. Click **Settings** , and then click **Add Data**.
3. Optional: To expand the search results to include public datasets, click the **Public datasets** toggle to the on position.
4. Optional: To change the scope of the search results to different projects, select the appropriate project option from the **Scope** menu.
5. Select the checkbox for each of the tables that you want to add to the assistant.
1. To search for tables that aren't suggested by the assistant, click **Search
for tables**.
2. In the **Natural language** prompt field, enter a prompt describing what table you are looking for, and then press Enter.
3. Select the checkbox for each of the tables you want to add to the assistant, and then click **Ok**.
6. Close the **Canvas assistant settings** pane.
The assistant bases its analysis on the data you choose.
### Add instructions
When you work with the Gemini chat interface, you can add
instructions so that the assistant knows how to behave. These instructions are
applied to all prompts within the data canvas. Examples of potential instructions
include the following:
- `Visualize trends over time.`
- `Chart colors: Red (negative), Green (positive)`
- `Domain: USA`
To add instructions to the assistant, do the following:
1. To open the assistant, on the data canvas, click spark **Open Data Canvas Assistant**.
2. Click **Settings**.
3. In the **Instructions** field, add a list of your instructions for the assistant, and then close the **Canvas assistant settings** pane.
The assistant remembers the instructions and applies them to future prompts.
### Gemini assistant best practices
To get the best results when working with the BigQuery data canvas
assistant, follow these best practices:
- **Be specific and unambiguous.** Clearly state what you want to calculate,
analyze, or visualize. For example, instead of `Analyze trip data`, say
`Calculate the average trip duration for trips starting in council district
eight`.
- **Ensure accurate data context.** The assistant can only work with the data
you provide. Ensure all relevant tables and columns have been added to the
canvas.
- **Start simply, then iterate.** Begin with a straightforward question to
ensure the assistant understands the basic structure and data. For example,
first say `` Show total trips by `subscriber_type` ``, and then say
`` Show total trips by `subscriber_type` and break down the result by
`council_district` ``.
- **Break down complex questions.** For multi-step processes, consider phrasing
your prompt clearly with distinct parts, or using separate prompts for each
major step. For example, say `First, find the top five busiest stations by
trip count. Second, calculate the average trip duration for trips starting
from only those top five stations`.
- **Clearly state calculations.** Specify the chosen calculation, such as `SUM`,
`MAX`, or `AVERAGE`. For example, say `` Find the `MAX` trip duration per
`bike_id` ``.
- **Use system instructions for persistent context and preferences.** Use
[system instructions](https://docs.cloud.google.com/bigquery/docs/data-canvas#add_instructions) to state information rules, and
preferences that apply across all prompts.
- **Review the canvas.** Always review the generated nodes to verify that the
logic aligns with your request and the results are accurate.
- **Experiment.** Try different phrasing, levels of detail, and prompt
structures to learn how the assistant responds to your specific data and
analytical needs.
- **Reference column names.** Whenever possible, use the actual column names
from your selected data. For example, instead of `Show trips by
subscriber type`, say `` Show the count of trips grouped by
`subscriber_type` and `start_station_name` ``.
### Example workflow: Work with a Gemini assistant
In this example, you use natural language prompts with the Gemini assistant to find, query, and visualize data.
1. In the Google Cloud console, go the **BigQuery** page.
[Go to BigQuery](https://console.cloud.google.com/bigquery)
2. In the query editor, next to
**SQL query** , click
**Create new** , select **AI and knowledge** , and then click **Data canvas**.

3. Click **Search for data**.
4. Click filter_list **Edit search
filters** , and then, in the **Filter search** pane, click the **BigQuery
public datasets** toggle to the on position.
5. In the **Natural language** prompt field, enter the following natural language prompt:
bikeshare
BigQuery data canvas generates a list of potential tables based on
Knowledge Catalog metadata. You can select multiple tables.
6. Select `bigquery-public-data.austin_bikeshare.bikeshare_stations` table and `bigquery-public-data.austin_bikeshare.bikeshare_trips`, and then
click **Add to canvas**.
A table node for each of the selected tables is added to BigQuery data canvas. To
view schema information, view table details, or preview the data, select
the various tabs in the table node.
7. To open the assistant, on the data canvas, click
spark **Open Data Canvas Assistant**.
8. Click **Settings**.
9. In the **Instructions** field, add the following instructions for the
assistant:
Tasks:
- Visualize findings with charts
- Show many charts per question
- Make sure to cover each part via a separate line of reasoning
10. Close the **Canvas assistant settings** pane.
11. In the **Ask a data question** field, enter the following natural language
prompt:
Show the number of trips by council district and subscriber type
12. You can continue to enter prompts in the **Ask a data question** field. Enter
the following natural language prompt:
What are most popular stations among the top 5 subscriber types
13. Enter the final prompt:
What station is least used to start and end a trip
Once you've asked all of the relevant prompts, your canvas is populated with the
relevant query and visualization nodes according to the prompts and instructions
you gave the assistant. Continue to enter prompts or modify existing prompts to
get the results you are looking for.
## View all data canvases
To view a list of all data canvases in your project, do the following:
1. In the Google Cloud console, go to the
**BigQuery** page.
[Go to BigQuery](https://console.cloud.google.com/bigquery)
2. In the left pane, click **Explorer**:

If you don't see the left pane, click **Expand left pane** to open the pane.
3. In the **Explorer** pane,
click
**View actions** next to **Data canvases**, and then do one of the following:
- To open the list in the current tab, click **Show all**.
- To open the list in a new tab, click **Show all in \> New tab**.
- To open the list in a split tab, click **Show all in \> Split tab**.
## View data canvas metadata
To view data canvas metadata, do the following:
1. In the Google Cloud console, go to the
**BigQuery** page.
[Go to BigQuery](https://console.cloud.google.com/bigquery)
2. In the left pane, click **Explorer**:

3. In the **Explorer** pane, expand your project and click **Data canvases**.
4. Click the name of the data canvas you want to view metadata for.
5. Click **Details**
to see information about the data canvas such as the
[region](https://docs.cloud.google.com/bigquery/docs/saved-queries-introduction#supported_regions)
it uses and the date it was last modified.
## Work with data canvas versions
You can choose to create a data canvas either inside of or outside of
a [repository](https://docs.cloud.google.com/bigquery/docs/repository-intro). Data canvas versioning
is handled differently based on where the data canvas is located.
### Data canvas versioning in repositories
Repositories are Git repositories that reside either in BigQuery
or with a third-party provider. You can use
[workspaces](https://docs.cloud.google.com/bigquery/docs/workspaces-intro) in repositories to perform
version control on data canvases. For more information, see
[Use version control with a file](https://docs.cloud.google.com/bigquery/docs/workspaces#use_version_control_with_a_file).
### Data canvas versioning outside of repositories
You can view, compare, and restore versions of a data canvas.
#### View and compare data canvas versions
To view different versions of a data canvas and compare them with the current
version, do the following:
1. In the Google Cloud console, go to the
**BigQuery** page.
[Go to BigQuery](https://console.cloud.google.com/bigquery)
2. In the left pane, click **Explorer**:

3. In the **Explorer** pane, expand your project and click **Data canvases**.
4. Click the name of the data canvas that you want to view version history for.
5. Click **Version history**
to see a list of the data canvas versions in
descending order by date.
6. Click **View actions**
next to a data canvas version and then click **Compare**.
The comparison pane opens, comparing the data canvas version that you
selected with the current data canvas version.
7. Optional: To compare the versions inline instead of in separate panes,
click **Compare** and then click **Inline**.
#### Restore a data canvas version
Restoring from the comparison pane lets you compare the previous version of
the data canvas to the current version before choosing whether to restore it.
1. In the left pane, click **Explorer**:

2. In the **Explorer** pane, expand your project and click **Data canvases**.
3. Click the name of the data canvas that you want to restore a previous version of.
4. Click **Version history**.
5. Click
**View actions** next to the version of the data canvas that you want to
restore, and then click **Compare**.
The comparison pane opens, comparing the data canvas
version that you selected with the most recent data canvas version.
6. To restore the previous data canvas version after
comparison, click **Restore**.
7. Click **Confirm**.
## Manage metadata in Knowledge Catalog
[Knowledge Catalog](https://docs.cloud.google.com/knowledge-catalog/docs/introduction) lets you view and
manage metadata for data canvases. Data canvases are available in
Knowledge Catalog by default, without additional configuration.
You can use Knowledge Catalog to manage data canvases
in all [BigQuery locations](https://docs.cloud.google.com/bigquery/docs/locations).
Managing data canvases in Knowledge Catalog
is subject to [Knowledge Catalog quotas and limits](https://docs.cloud.google.com/knowledge-catalog/docs/quotas)
and [Knowledge Catalog pricing](https://cloud.google.com/dataplex/pricing).
Knowledge Catalog automatically retrieves
the following metadata from data canvases:
- Data asset name
- Data asset parent
- Data asset location
- Data asset type
- Corresponding Google Cloud project
Knowledge Catalog logs data canvases as
[entries](https://docs.cloud.google.com/knowledge-catalog/docs/ingest-custom-sources#entries) with the following
entry values:
System entry group
: The [system entry group](https://docs.cloud.google.com/knowledge-catalog/docs/ingest-custom-sources#entry-groups)
for data canvases is `@dataform`. To view details of data canvas entries
in Knowledge Catalog, you need to view the `dataform` system entry group.
For instructions about how to view a list of all entries in an entry group, see
[View details of an entry group](https://docs.cloud.google.com/knowledge-catalog/docs/ingest-custom-sources#entry-group-details)
in the Knowledge Catalog documentation.
System entry type
: The [system entry type](https://docs.cloud.google.com/knowledge-catalog/docs/ingest-custom-sources#entry-types)
for data canvases is `dataform-code-asset`. To view details of data canvases,
you need to view the `dataform-code-asset` system entry type,
filter the results with an aspect-based filter,
and [set the `type` field inside `dataform-code-asset` aspect to `DATA_CANVAS`](https://docs.cloud.google.com/knowledge-catalog/docs/search-syntax#aspect-search).
Then, select an entry of the selected data canvas.
For instructions about how to view details of a selected entry type, see
[View details of an entry type](https://docs.cloud.google.com/knowledge-catalog/docs/ingest-custom-sources#entry-type-details)
in the Knowledge Catalog documentation.
For instructions about how to view details of a selected entry, see
[View details of an entry](https://docs.cloud.google.com/knowledge-catalog/docs/search-assets#view-entry-details)
in the Knowledge Catalog documentation.
System aspect type
: The [system aspect type](https://docs.cloud.google.com/knowledge-catalog/docs/enrich-entries-metadata#aspect-types)
for data canvases is `dataform-code-asset`. To
provide additional context to data canvases in Knowledge Catalog
by annotating data canvas entries with
[aspects](https://docs.cloud.google.com/knowledge-catalog/docs/enrich-entries-metadata#aspects),
view the `dataform-code-asset` aspect type,
filter the results with an aspect-based filter,
and [set the `type` field inside `dataform-code-asset` aspect to `DATA_CANVAS`](https://docs.cloud.google.com/knowledge-catalog/docs/search-syntax#aspect-search).
For instructions about how to annotate entries with aspects, see
[Manage aspects and enrich metadata](https://docs.cloud.google.com/knowledge-catalog/docs/enrich-entries-metadata)
in the Knowledge Catalog documentation.
Type
: The type for data canvases is `DATA_CANVAS`.
This type lets you filter data canvases in the `dataform-code-asset`
system entry type and the `dataform-code-asset` aspect type by using the
`aspect:dataplex-types.global.dataform-code-asset.type=DATA_CANVAS`
query in an [aspect-based filter](https://docs.cloud.google.com/knowledge-catalog/docs/search-syntax#aspect-search).
For instructions about how to search for assets in Knowledge Catalog, see
[Search for data assets in Knowledge Catalog](https://docs.cloud.google.com/knowledge-catalog/docs/search-assets)
in the Knowledge Catalog documentation.
## Pricing
For details about pricing for this feature, see
[Gemini in BigQuery pricing overview](https://cloud.google.com/products/gemini/pricing#gemini-in-bigquery-pricing).
## Locations
You can use BigQuery data canvas in all [BigQuery
locations](https://docs.cloud.google.com/bigquery/docs/locations). To learn about where Gemini
in BigQuery processes your data, see [Where Gemini
in BigQuery processes your data](https://docs.cloud.google.com/bigquery/docs/gemini-locations).
## Provide feedback
You can help improve BigQuery data canvas suggestions by submitting
feedback to Google. To provide feedback, do the following:
1. In the BigQuery data canvas toolbar, click **More actions** , and then click **Submit feedback**.
2. Click the category your feedback applies to.
3. In the **Describe your feedback (required)** field, enter your feedback.
4. Optional: To provide BigQuery with a screenshot of your data canvas, click screenshot_monitor **Capture screenshot**.
5. Optional: To provide your generation history, select **Allow Google to
collect my generation history and submit it with my feedback.**
6. Click **Send**.
Data sharing settings apply to the entire project and can only be set by a
project administrator who has the `serviceusage.services.enable` and
`serviceusage.services.list` IAM permissions.
To provide direct feedback about this feature, you can also contact
[datacanvas-feedback@google.com](mailto:datacanvas-feedback@google.com).
## What's next
- Learn how to [write queries with Gemini
assistance](https://docs.cloud.google.com/bigquery/docs/write-sql-gemini).
- Learn how to [create notebooks](https://docs.cloud.google.com/bigquery/docs/create-notebooks).
- Learn how to generate natural language queries about your data with
[data insights](https://docs.cloud.google.com/bigquery/docs/data-insights).