# Limit forecasted values for an ARIMA_PLUS time series model
This tutorial teaches you how to use limits to narrow the forecasted results returned by an `ARIMA_PLUS` time series model. In this tutorial, you create two time series models over the same data, one model which uses limits and one model that doesn't use limits. This lets you compare the results returned by the models
and understand the difference that specifying limits makes.
You use the
[`new_york.citibike_trips`](https://console.cloud.google.com/bigquery?p=bigquery-public-data&d=new_york&t=citibike_trips&page=table) data to train the models in this tutorial. This dataset contains information about Citi Bike trips in New York City.
Before following this tutorial, you should be familiar with single time series forecasting. Complete the
[Single time series forecasting from Google Analytics data](https://docs.cloud.google.com/bigquery/docs/arima-single-time-series-forecasting-tutorial) tutorial for an introduction to this topic.
## Required Permissions
- To create the dataset, you need the `bigquery.datasets.create`
IAM permission.
- To create the model, you need the following permissions:
- `bigquery.jobs.create`
- `bigquery.models.create`
- `bigquery.models.getData`
- `bigquery.models.updateData`
- To run inference, you need the following permissions:
- `bigquery.models.getData`
- `bigquery.jobs.create`
For more information about IAM roles and permissions in
BigQuery, see
[Introduction to IAM](https://docs.cloud.google.com/bigquery/docs/access-control).
## Objectives
In this tutorial, you use the following:
- The [`CREATE MODEL`](https://docs.cloud.google.com/bigquery/docs/reference/standard-sql/bigqueryml-syntax-create-time-series) statement: to create a time series model.
- The [`ML.FORECAST`](https://docs.cloud.google.com/bigquery/docs/reference/standard-sql/bigqueryml-syntax-forecast) function: to forecast daily total visits.
## Costs
This tutorial uses billable components of Google Cloud, including the following:
- BigQuery
- BigQuery ML
For more information about BigQuery costs, see the
[BigQuery pricing](https://cloud.google.com/bigquery/pricing) page.
For more information about BigQuery ML costs, see
[BigQuery ML pricing](https://cloud.google.com/bigquery/pricing#bqml).
## Before you begin
## Create a dataset
To create a BigQuery dataset, select one of the following options:
### Console
1. In the Google Cloud console, go to the **BigQuery** page.
[Go to BigQuery](https://console.cloud.google.com/bigquery)
2. In the left pane, click
**Explorer**:

If you don't see the left pane, click
**Expand left pane** to open the pane.
3. In **Explorer** , expand your project, and then click **Datasets**.
4. On the **Datasets** page, click
**Create dataset**.
5. In the **Create dataset** pane, do the following:
- For **Dataset ID** , enter `bqml_tutorial`.
- For **Data location** , select **US**.
Leave the remaining default settings as they are.
6. Click **Create dataset**.
### bq
To create a new dataset, use the
[`bq mk --dataset` command](https://docs.cloud.google.com/bigquery/docs/reference/bq-cli-reference#mk-dataset).
1. Create a dataset named `bqml_tutorial` with the data location set to `US`:
```
bq mk --dataset \
--location=US \
--description "BigQuery ML tutorial dataset." \
bqml_tutorial
```
2. Confirm that the dataset was created:
```bash
bq ls
```
### API
Call the [`datasets.insert`](https://docs.cloud.google.com/bigquery/docs/reference/rest/v2/datasets/insert)
method with a defined [dataset resource](https://docs.cloud.google.com/bigquery/docs/reference/rest/v2/datasets):
```json
{
"datasetReference": {
"datasetId": "bqml_tutorial"
}
}
```
### BigQuery DataFrames
Before trying this sample, follow the BigQuery DataFrames
setup instructions in the [BigQuery quickstart
using BigQuery DataFrames](https://docs.cloud.google.com/bigquery/docs/dataframes-quickstart).
For more information, see the
[BigQuery DataFrames reference documentation](https://docs.cloud.google.com/python/docs/reference/bigframes/latest).
To authenticate to BigQuery, set up Application Default Credentials.
For more information, see [Set
up ADC for a local development environment](https://docs.cloud.google.com/docs/authentication/set-up-adc-local-dev-environment).
import google.cloud.bigquery
bqclient = google.cloud.https://docs.cloud.google.com/python/docs/reference/bigquery/latest.https://docs.cloud.google.com/python/docs/reference/bigquery/latest/google.cloud.bigquery.client.Client.html()
bqclient.https://docs.cloud.google.com/python/docs/reference/bigquery/latest/google.cloud.bigquery.client.Client.html#google_cloud_bigquery_client_Client_create_dataset("bqml_tutorial", exists_ok=True)
## Visualize the time series you want to forecast
Before creating the model, it is useful to see what your input time series
looks like.
### SQL
In the following query, the `FROM bigquery-public-data.new_york.citibike_trips`
clause indicates that you are querying the `citibike_trips` table in the
`new_york` dataset.
In the `SELECT` statement, the query uses the
[`EXTRACT` function](https://docs.cloud.google.com/bigquery/docs/reference/standard-sql/timestamp_functions#extract)
to extract the date information from the `starttime` column. The query uses
the `COUNT(*)` clause to get the daily total number of Citi Bike trips.
```googlesql
#standardSQL
SELECT
EXTRACT(DATE from starttime) AS date,
COUNT(*) AS num_trips
FROM
`bigquery-public-data`.new_york.citibike_trips
GROUP BY date
```
To run the query, use the following steps:
1. In the Google Cloud console, click the **Compose new query** button.
2. Enter the following GoogleSQL query in the query editor.
```googlesql
#standardSQL
SELECT
EXTRACT(DATE from starttime) AS date,
COUNT(*) AS num_trips
FROM
`bigquery-public-data`.new_york.citibike_trips
GROUP BY date
```
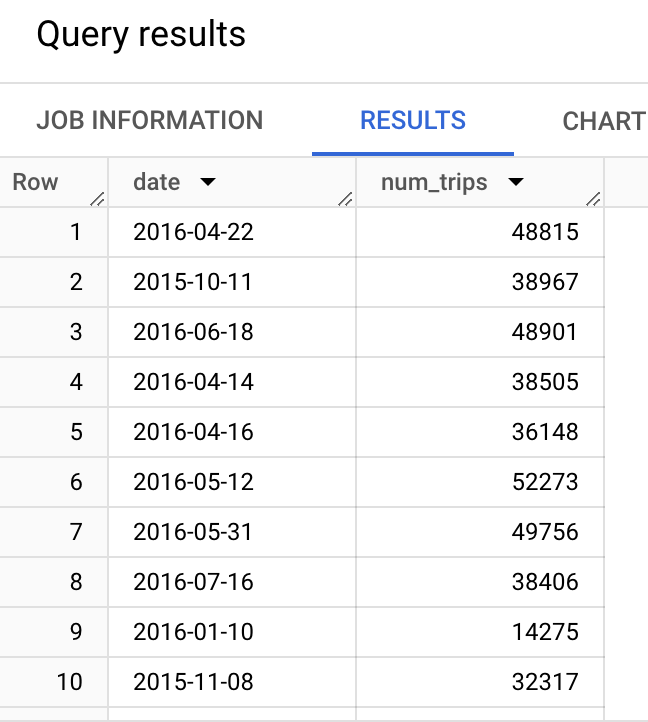
3. Click **Run**. The query results similar to the following.
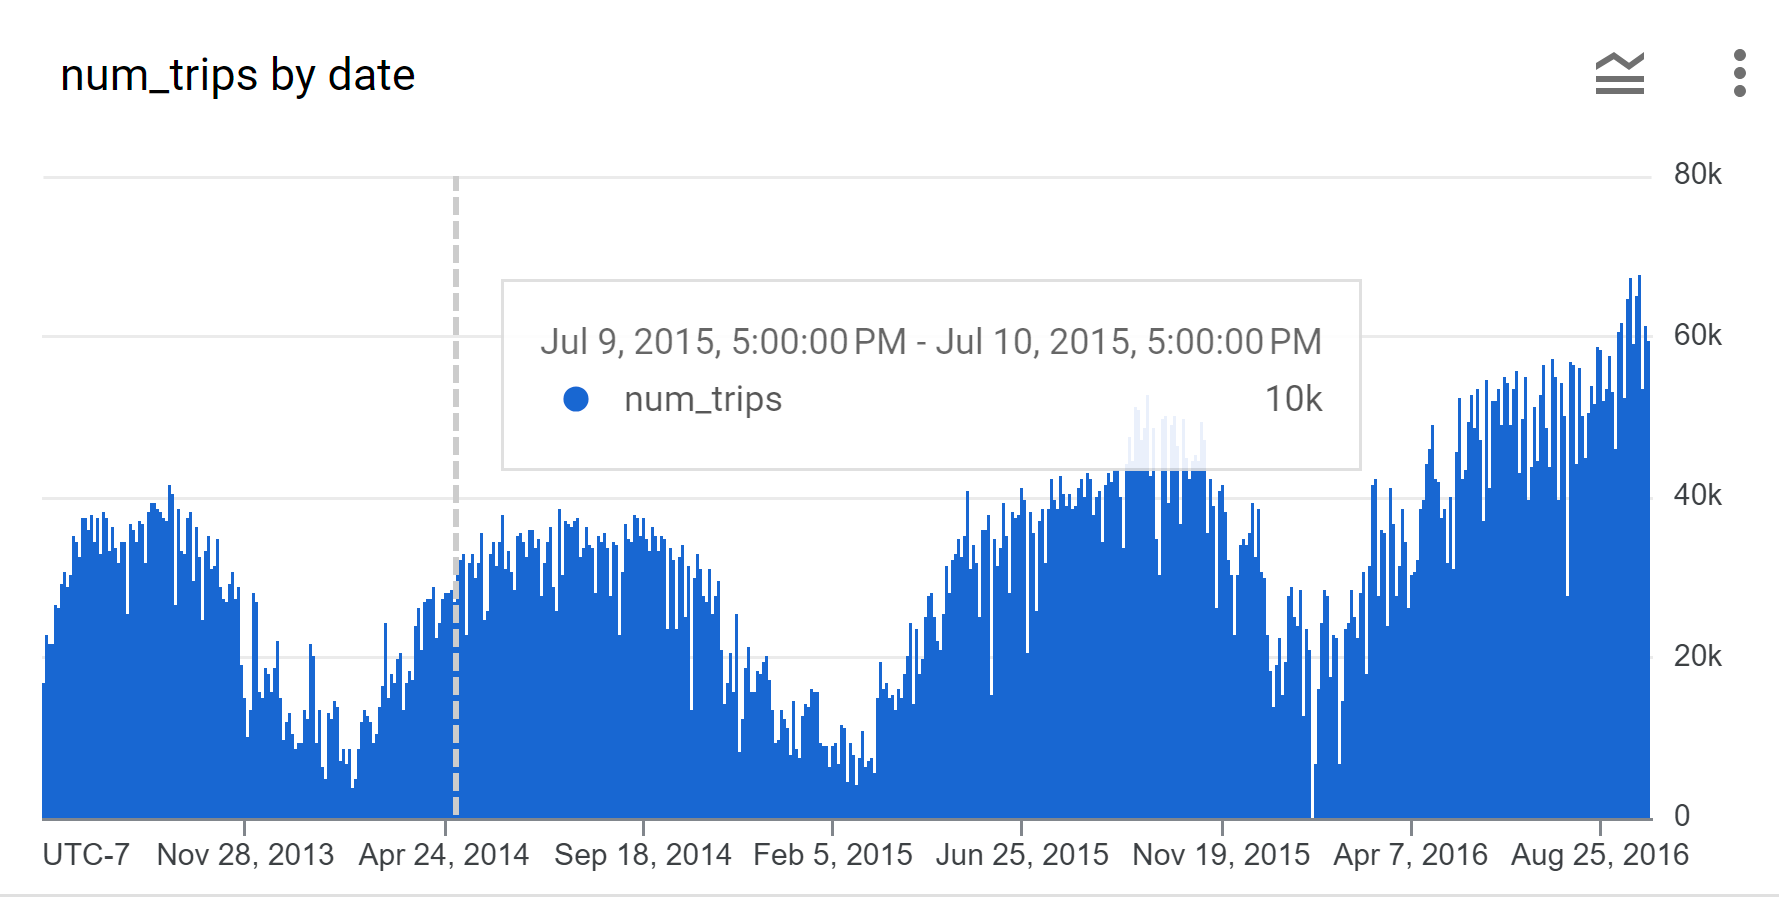
4. Use the Google Cloud console to chart the time series data. In the **Query results** pane, click the **Visualization** tab. In the **Visualization configuration** pane, choose **Bar** for the **Visualization type**:
### BigQuery DataFrames
Before trying this sample, follow the BigQuery DataFrames
setup instructions in the [BigQuery quickstart
using BigQuery DataFrames](https://docs.cloud.google.com/bigquery/docs/dataframes-quickstart).
For more information, see the
[BigQuery DataFrames reference documentation](https://docs.cloud.google.com/python/docs/reference/bigframes/latest).
To authenticate to BigQuery, set up Application Default Credentials.
For more information, see [Set
up ADC for a local development environment](https://docs.cloud.google.com/docs/authentication/set-up-adc-local-dev-environment).
In the following sample, `bigquery-public-data.new_york.citibike_trips`
indicates that you are querying the `citibike_trips` table in the
`new_york` dataset.
import bigframes.pandas as bpd
df = bpd.read_gbq("bigquery-public-data.new_york.citibike_trips")
features = bpd.DataFrame(
{
"num_trips": df.starttime,
"date": df["starttime"].dt.date,
}
)
num_trips = features.groupby(["date"]).count()
num_trips.plot.line()
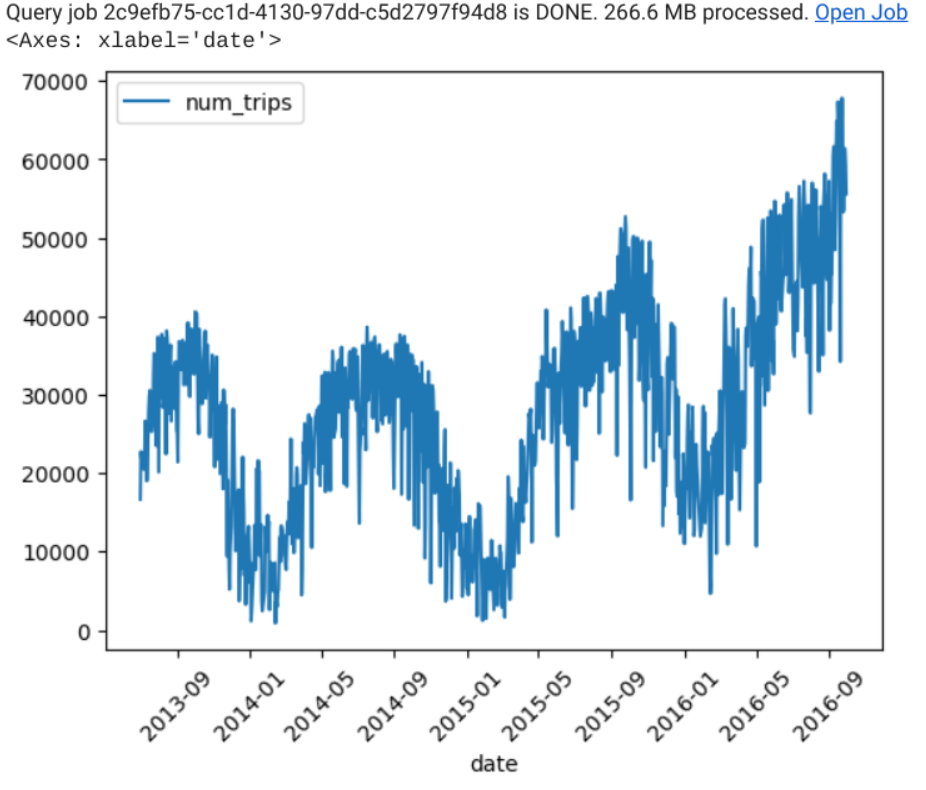
The result is similar to the following:
## Create a time series model
Create a time series model, using the NYC Citi Bike trips data.
The following GoogleSQL query creates a model that forecasts daily total
bike trips. The [`CREATE MODEL`](https://docs.cloud.google.com/bigquery/docs/reference/standard-sql/bigqueryml-syntax-create-time-series)
statement creates and trains a model named `bqml_tutorial.nyc_citibike_arima_model`.
```googlesql
#standardSQL
CREATE OR REPLACE MODEL bqml_tutorial.nyc_citibike_arima_model
OPTIONS (
model_type = 'ARIMA_PLUS',
time_series_timestamp_col = 'date',
time_series_data_col = 'num_trips',
time_series_id_col = 'start_station_id')
AS
SELECT
EXTRACT(DATE FROM starttime) AS date,
COUNT(*) AS num_trips,
start_station_id
FROM
`bigquery-public-data`.new_york.citibike_trips
WHERE starttime > '2014-07-11' AND starttime < '2015-02-11'
GROUP BY date, start_station_id;
```
The `OPTIONS(model_type='ARIMA_PLUS', time_series_timestamp_col='date', ...)`
clause indicates that you are creating an
[ARIMA](https://en.wikipedia.org/wiki/Autoregressive_integrated_moving_average)-based
time series model. By default,
[`auto_arima=TRUE`](https://docs.cloud.google.com/bigquery/docs/reference/standard-sql/bigqueryml-syntax-create-time-series#auto_arima),
so the `auto.ARIMA` algorithm automatically tunes the hyperparameters in
`ARIMA_PLUS` models. The algorithm fits dozens of candidate models and chooses
the best one with the lowest
[Akaike information criterion (AIC)](https://en.wikipedia.org/wiki/Akaike_information_criterion).
Additionally, because the default is
`data_frequency='AUTO_FREQUENCY'`, the training process automatically infers
the data frequency of the input time series. The `CREATE MODEL` statement uses
[`decompose_time_series=TRUE`](https://docs.cloud.google.com/bigquery/docs/reference/standard-sql/bigqueryml-syntax-create-time-series#decompose_time_series)
by default, so both the history and forecast parts of the time series are saved in the model. Setting the parameter `time_series_id_col = 'start_station_id'` causes the model to fit and forecast multiple time series using a single query based on the `start_station_id`. You can use this information to further understand how the time series is forecasted
by fetching the separate time series components such as seasonal periods.
Run the `CREATE MODEL` query to create and train your model:
1. In the Google Cloud console, click the **Compose new query** button.
2. Enter the following GoogleSQL query in the query editor.
```googlesql
#standardSQL
CREATE OR REPLACE MODEL bqml_tutorial.nyc_citibike_arima_model
OPTIONS (
model_type = 'ARIMA_PLUS',
time_series_timestamp_col = 'date',
time_series_data_col = 'num_trips',
time_series_id_col = 'start_station_id')
AS
SELECT
EXTRACT(DATE FROM starttime) AS date,
COUNT(*) AS num_trips,
start_station_id
FROM
`bigquery-public-data`.new_york.citibike_trips
WHERE starttime > '2014-07-11' AND starttime < '2015-02-11'
GROUP BY date, start_station_id;
```
3. Click **Run**.
The query takes approximately 80 seconds to complete, after which you can
access the (`nyc_citibike_arima_model`) model. Because the query uses a
`CREATE MODEL` statement to create a model, there are no query results.
> [!NOTE]
> **Note:** You might wonder if United States holidays have an impact on the time series. You can try adding [holiday_region='US'](https://docs.cloud.google.com/bigquery/docs/reference/standard-sql/bigqueryml-syntax-create-time-series#holiday_region) to the `OPTIONS` list in the query. This allows a more accurate modeling on those United States holidays time points if there are indeed United States holiday patterns in the time series.
## Forecast the time series and visualize the results
To explain how the time series is forecasted, visualize all the sub-time series
components, such as seasonality and trend, using the
[`ML.FORECAST`](https://docs.cloud.google.com/bigquery/docs/reference/standard-sql/bigqueryml-syntax-forecast)
function.
To do this, follow these steps:
1. In the Google Cloud console, click the **Compose new query** button.
2. Enter the following GoogleSQL query in the query editor.
```googlesql
#standardSQL
SELECT
forecast_timestamp AS forecast_timestamp,
start_station_id AS start_station_id,
history_value AS history_value,
forecast_value AS forecast_value
FROM
(
(
SELECT
DATE(forecast_timestamp) AS forecast_timestamp,
NULL AS history_value,
forecast_value AS forecast_value,
start_station_id AS start_station_id,
FROM
ML.FORECAST(
MODEL bqml_tutorial.`nyc_citibike_arima_model`,
STRUCT(
365 AS horizon,
0.9 AS confidence_level))
)
UNION ALL
(
SELECT
DATE(date_name) AS forecast_timestamp,
num_trips AS history_value,
NULL AS forecast_value,
start_station_id AS start_station_id,
FROM
(
SELECT
EXTRACT(DATE FROM starttime) AS date_name,
COUNT(*) AS num_trips,
start_station_id AS start_station_id
FROM
`bigquery-public-data`.new_york.citibike_trips
WHERE
starttime > '2014-07-11'
AND starttime < '2015-02-11'
GROUP BY
date_name, start_station_id
)
)
)
WHERE start_station_id = 79
ORDER BY
forecast_timestamp, start_station_id
```
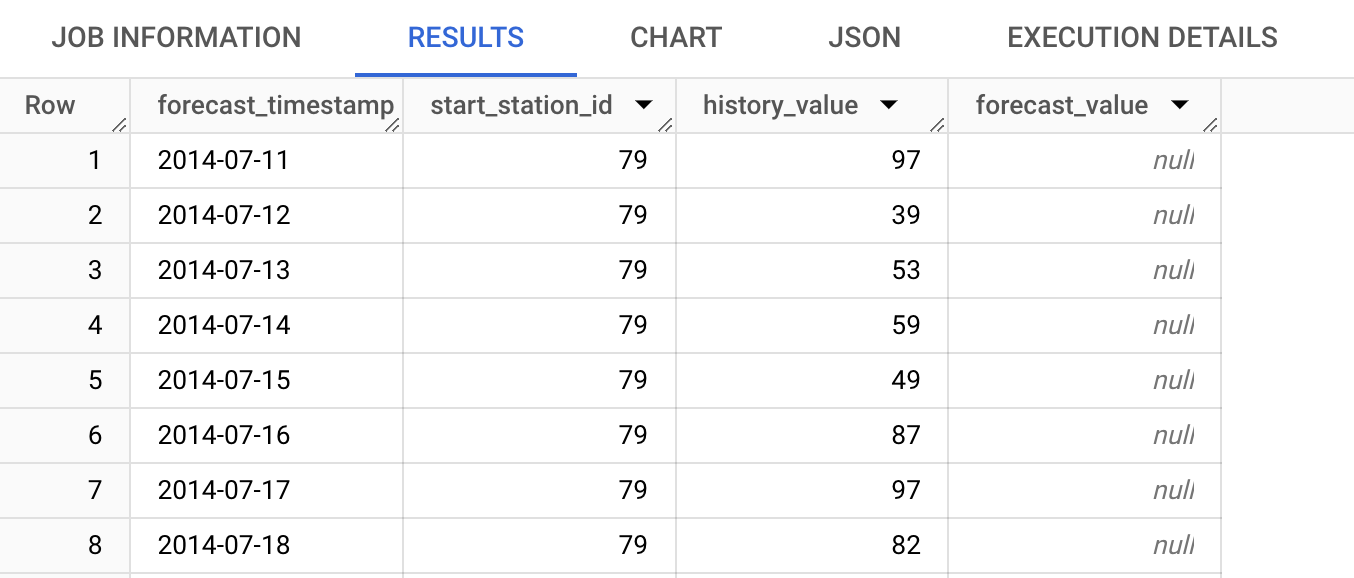
3. Click **Run**. The query results similar to the following:
4. Use the Google Cloud console to chart the time series data. In the **Query results** pane, click the **Visualization** tab:
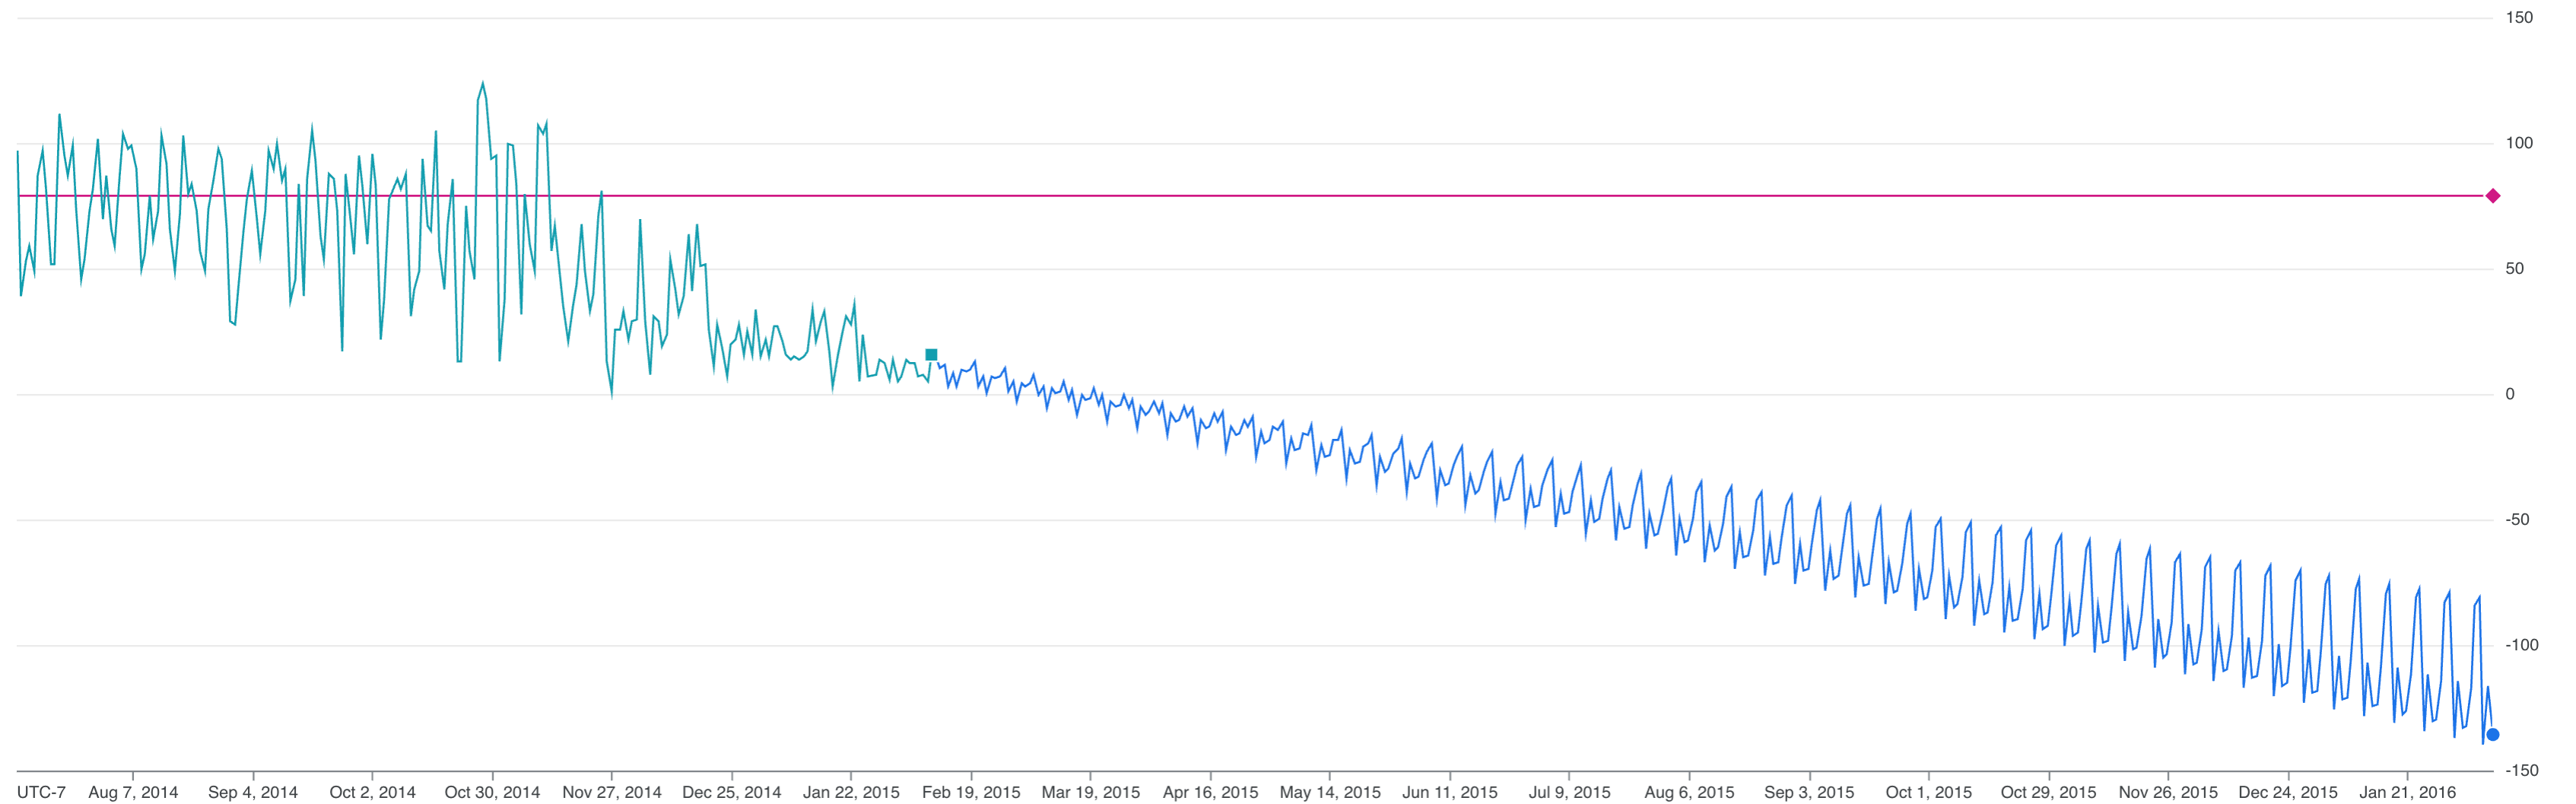
The chart shows that the forecasted values for the daily total number of Citi
Bike trips where `start_station_id=79` are negative numbers, which isn't useful. Using a model with limits instead improves the forecasted data.
## Create a time series model with limits
Create a time series model with limits, using the NYC Citi Bike trips data.
The following GoogleSQL query creates a model that forecasts daily total
bike trips. The [`CREATE MODEL`](https://docs.cloud.google.com/bigquery/docs/reference/standard-sql/bigqueryml-syntax-create-time-series)
statement creates and trains a model named `bqml_tutorial.nyc_citibike_arima_model_with_limits`.
The key difference between this model and the [model you created previously](https://docs.cloud.google.com/bigquery/docs/arima-time-series-forecasting-with-limits-tutorial#forecast_the_time_series_and_visualize_the_results) is the addition of the `forecast_limit_lower_bound=0` option. This option causes the model to only forecast values that are greater than 0, based on the values in the column specified by the `time_series_data_col` argument, in this case `num_trips`.
```googlesql
#standardSQL
CREATE OR REPLACE MODEL bqml_tutorial.nyc_citibike_arima_model
OPTIONS (
model_type = 'ARIMA_PLUS',
time_series_timestamp_col = 'date',
time_series_data_col = 'num_trips',
time_series_id_col = 'start_station_id',
forecast_limit_lower_bound = 0)
AS
SELECT
EXTRACT(DATE FROM starttime) AS date,
COUNT(*) AS num_trips,
start_station_id
FROM
`bigquery-public-data`.new_york.citibike_trips
WHERE starttime > '2014-07-11' AND starttime < '2015-02-11'
GROUP BY date, start_station_id;
```
Run the `CREATE MODEL` query to create and train your model:
1. In the Google Cloud console, click the **Compose new query** button.
2. Enter the following GoogleSQL query in the query editor.
```googlesql
#standardSQL
CREATE OR REPLACE MODEL bqml_tutorial.nyc_citibike_arima_model
OPTIONS (
model_type = 'ARIMA_PLUS',
time_series_timestamp_col = 'date',
time_series_data_col = 'num_trips',
time_series_id_col = 'start_station_id',
forecast_limit_lower_bound = 0)
AS
SELECT
EXTRACT(DATE FROM starttime) AS date,
COUNT(*) AS num_trips,
start_station_id
FROM
`bigquery-public-data`.new_york.citibike_trips
WHERE starttime > '2014-07-11' AND starttime < '2015-02-11'
GROUP BY date, start_station_id;
```
3. Click **Run**.
The query takes approximately 100 seconds to complete, after which you can
access the (`nyc_citibike_arima_model_with_limits`) model. Because the query
uses a `CREATE MODEL` statement to create a model, there are no query results.
> [!NOTE]
> **Note:** You might wonder if United States holidays have an impact on the time series. You can try adding [holiday_region='US'](https://docs.cloud.google.com/bigquery/docs/reference/standard-sql/bigqueryml-syntax-create-time-series#holiday_region) to the `OPTIONS` list in the query. This allows a more accurate modeling on those United States holidays time points if there are indeed United States holiday patterns in the time series.
## Forecast the time series by using the model with limits
1. In the Google Cloud console, click the **Compose new query** button.
2. Enter the following GoogleSQL query in the query editor.
```googlesql
#standardSQL
SELECT
forecast_timestamp AS forecast_timestamp,
start_station_id AS start_station_id,
history_value AS history_value,
forecast_value AS forecast_value
FROM
(
(
SELECT
DATE(forecast_timestamp) AS forecast_timestamp,
NULL AS history_value,
forecast_value AS forecast_value,
start_station_id AS start_station_id,
FROM
ML.FORECAST(
MODEL bqml_tutorial.`nyc_citibike_arima_model`,
STRUCT(
365 AS horizon,
0.9 AS confidence_level))
)
UNION ALL
(
SELECT
DATE(date_name) AS forecast_timestamp,
num_trips AS history_value,
NULL AS forecast_value,
start_station_id AS start_station_id,
FROM
(
SELECT
EXTRACT(DATE FROM starttime) AS date_name,
COUNT(*) AS num_trips,
start_station_id AS start_station_id
FROM
`bigquery-public-data`.new_york.citibike_trips
WHERE
starttime > '2014-07-11'
AND starttime < '2015-02-11'
GROUP BY
date_name, start_station_id
)
)
)
WHERE start_station_id = 79
ORDER BY forecast_timestamp, start_station_id
```
3. Click **Run**.
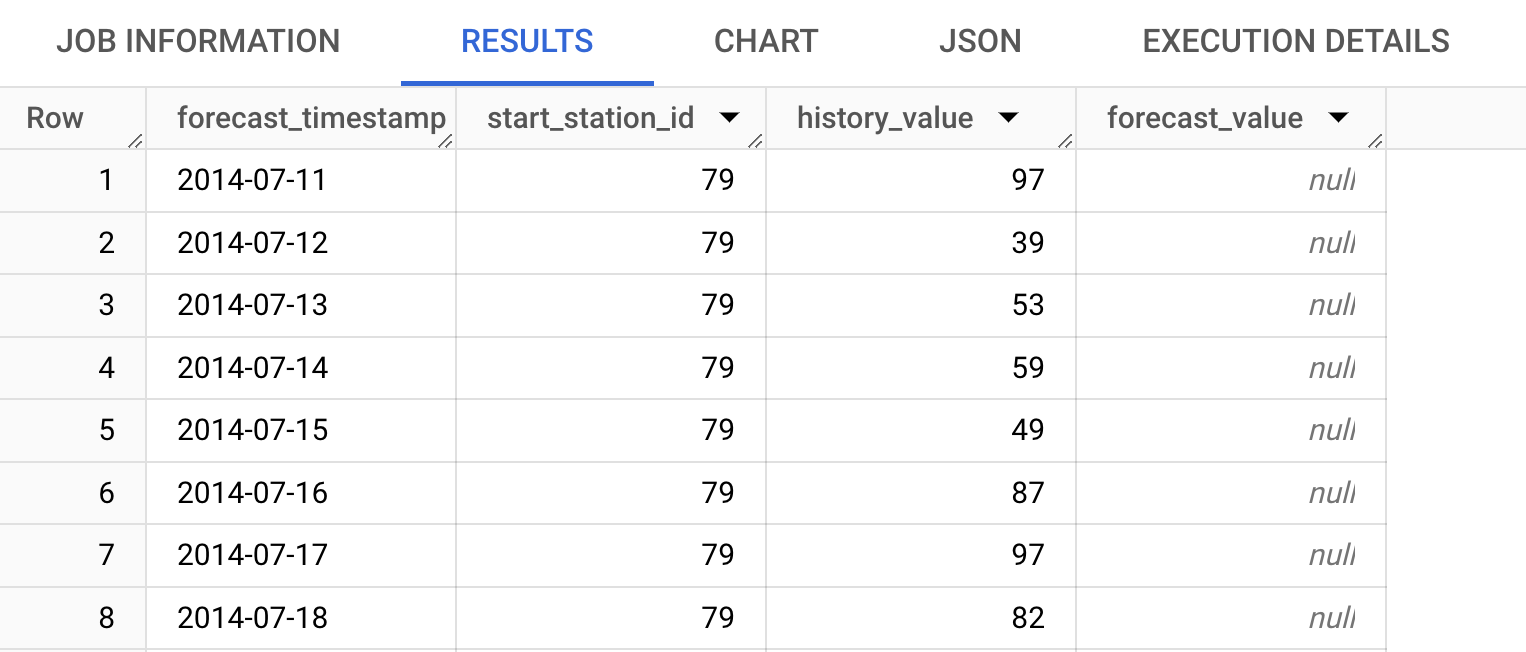
4. Use the Google Cloud console to chart the time series data. In the **Query results** pane, click the **Visualization** tab:
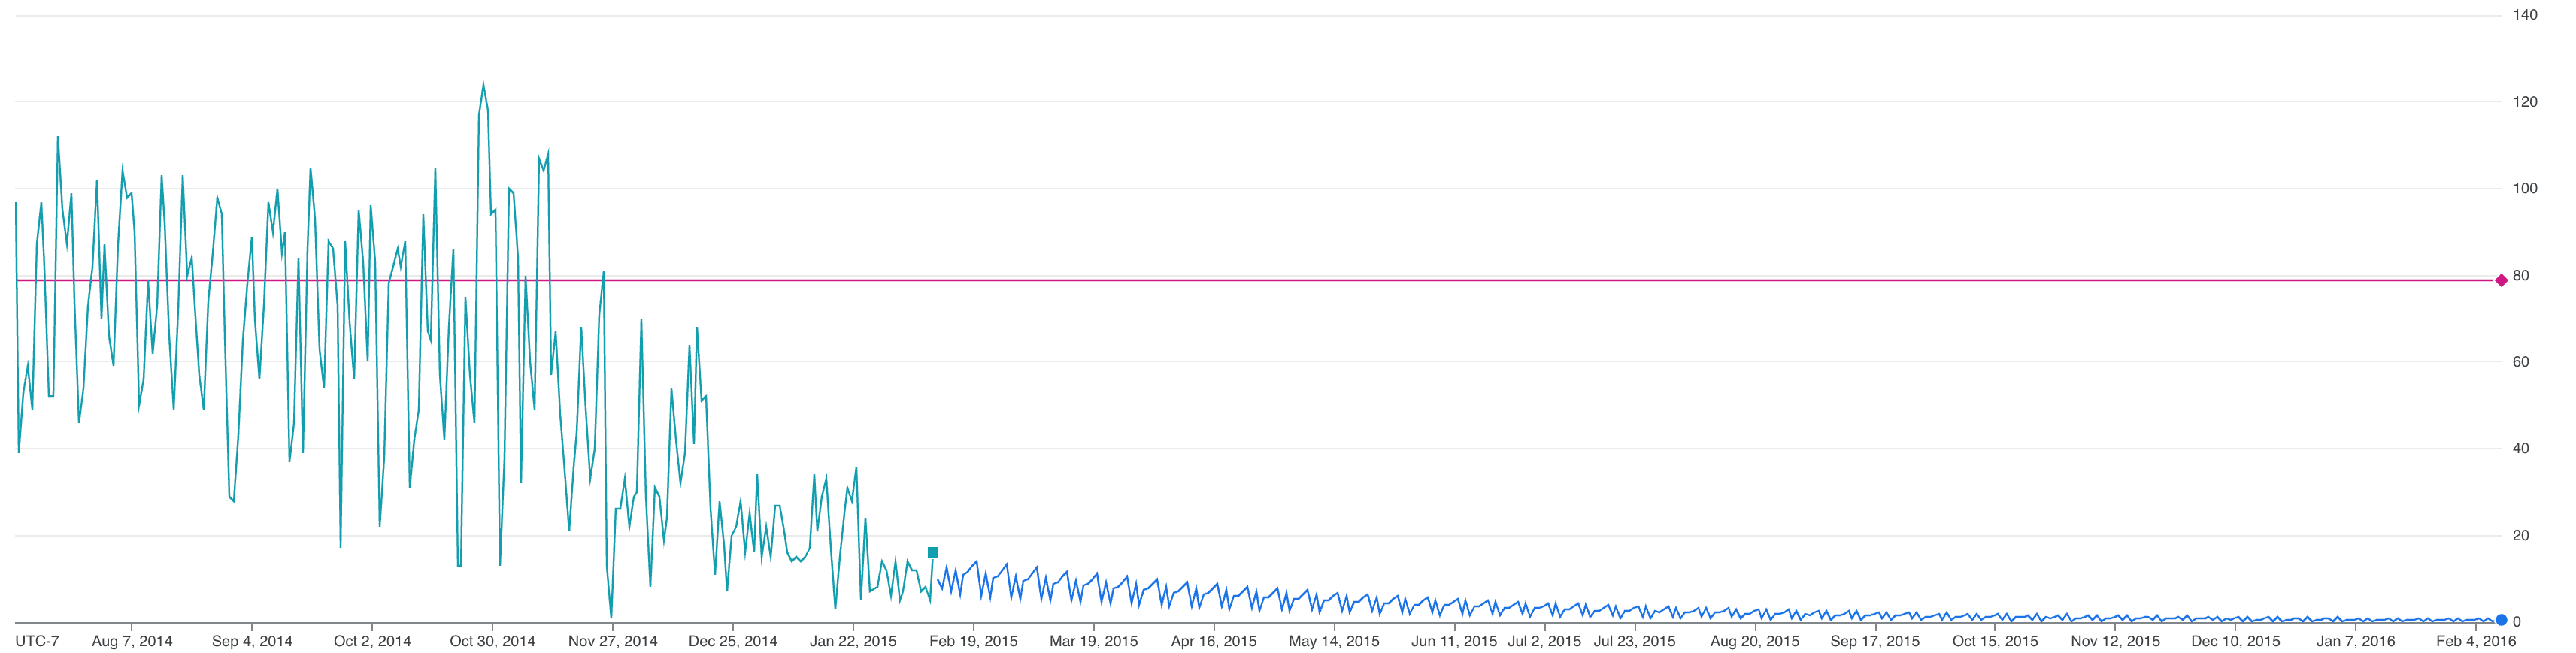
The ARIMA PLUS model detects that the daily total number of Citi Bike trips where `start_station_id=79` is decreasing. Future forecasting values will follow this trend and give relatively smaller forecasting numbers the farther into the future you go. The chart shows that the forecasted values for the daily total number of Citi
Bike trips where `start_station_id=79` are positive numbers, which is more useful. The model with limits
detects that the daily total number of Citi Bike trips where `start_station_id=79` is decreasing, but it still gives meaningful forecasting values.
As this tutorial shows, the `forecast_limit_lower_bound` and `forecast_limit_upper_bound` options can help you get more meaningful forecasting values in similar scenarios to the one shown here, such as when forecasting stock prices or future sales numbers.
### Delete your dataset
Deleting your project removes all datasets and all tables in the project. If you
prefer to reuse the project, you can delete the dataset you created in this
tutorial:
1. If necessary, open the BigQuery page in the
Google Cloud console.
[Go to the BigQuery page](https://console.cloud.google.com/bigquery)
2. In the navigation, click the **bqml_tutorial** dataset you created.
3. Click **Delete dataset** on the right side of the window.
This action deletes the dataset, the table, and all the data.
4. In the **Delete dataset** dialog, confirm the delete command by typing
the name of your dataset (`bqml_tutorial`) and then click **Delete**.
### Delete your project
To delete the project:
> [!CAUTION]
> **Caution** : Deleting a project has the following effects:
>
> - **Everything in the project is deleted.** If you used an existing project for the tasks in this document, when you delete it, you also delete any other work you've done in the project.
> - **Custom project IDs are lost.** When you created this project, you might have created a custom project ID that you want to use in the future. To preserve the URLs that use the project ID, such as an `appspot.com` URL, delete selected resources inside the project instead of deleting the whole project.
>
>
> If you plan to explore multiple architectures, tutorials, or quickstarts, reusing projects
> can help you avoid exceeding project quota limits.
1. In the Google Cloud console, go to the **Manage resources** page.
[Go to Manage resources](https://console.cloud.google.com/iam-admin/projects)
2. In the project list, select the project that you want to delete, and then click **Delete**.
3. In the dialog, type the project ID, and then click **Shut down** to delete the project.
## What's next
- Learn how to [perform multiple time-series forecasting with a single query from NYC Citi Bike trips data](https://docs.cloud.google.com/bigquery/docs/arima-multiple-time-series-forecasting-tutorial).
- Learn how to [accelerate ARIMA_PLUS to enable forecast 1 million time series within hours](https://docs.cloud.google.com/bigquery/docs/arima-speed-up-tutorial).
- To learn more about machine learning, see the [Machine learning crash course](https://developers.google.com/machine-learning/crash-course/).
- For an overview of BigQuery ML, see [Introduction to BigQuery ML](https://docs.cloud.google.com/bigquery/docs/bqml-introduction).
- To learn more about the Google Cloud console, see [Using the Google Cloud console](https://docs.cloud.google.com/bigquery/docs/bigquery-web-ui).