This guide shows security practitioners how to onboard Google Cloud
logs to be used in security analytics. By performing security analytics, you
help your organization prevent, detect, and respond to threats like malware,
phishing, ransomware, and poorly configured assets.
This guide shows you how to do the following:
- Enable the logs to be analyzed.
- Route those logs to a single destination depending on your choice of security analytics tool, such as [Observability Analytics](https://docs.cloud.google.com/logging/docs/log-analytics#analytics), [BigQuery](https://docs.cloud.google.com/bigquery/docs), [Google Security Operations](https://docs.cloud.google.com/chronicle/docs), or a third-party security information and event management (SIEM) technology.
- Analyze those logs to audit your cloud usage and detect potential threats to your data and workloads, using sample queries from the [Community Security Analytics (CSA)](https://github.com/GoogleCloudPlatform/security-analytics) project.
The information in this guide is part of Google Cloud [Autonomic Security Operations](https://cloud.google.com/solutions/security-analytics-and-operations),
which includes engineering-led transformation of detection and response
practices and security analytics to improve your threat detection capabilities.
In this guide, logs provide the data source to be analyzed. However, you can
apply the concepts from this guide to analysis of other complementary
security-related data from Google Cloud, such as [security findings
from Security Command Center](https://docs.cloud.google.com/security-command-center/docs/concepts-vulnerabilities-findings).
Provided in Security Command Center Premium is a list of regularly-updated managed
detectors that are designed to identify threats, vulnerabilities, and
misconfigurations within your systems in near real-time. By analyzing these
signals from Security Command Center and correlating them with logs ingested in your
security analytics tool as described in this guide, you can achieve a broader
perspective of potential security threats.
The following diagram shows how security data sources, security analytics tools,
and CSA queries work together.
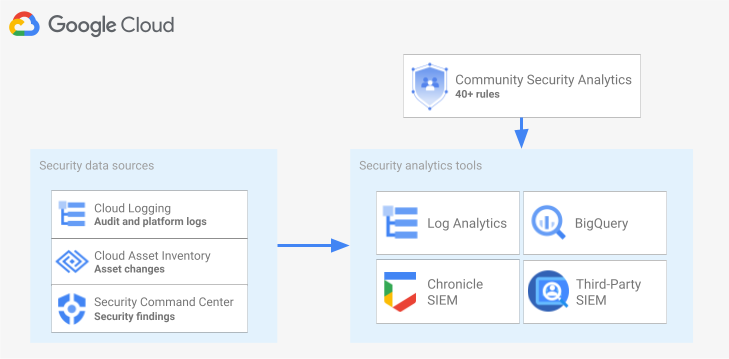
The diagram starts with the following security data sources: logs from
Cloud Logging, asset changes from Cloud Asset Inventory, and security findings from
Security Command Center. The diagram then shows these security data sources being
routed into the security analytics tool of your choice: Observability Analytics in Cloud Logging,
BigQuery, Google Security Operations, or a third-party SIEM. Finally, the
diagram shows using CSA queries with your analytics tool to analyze the collated
security data.
## Security log analytics workflow
This section describe the steps to set up security log analytics in
Google Cloud. The workflow consists of the three steps shown in the
following diagram and described in the following paragraphs:
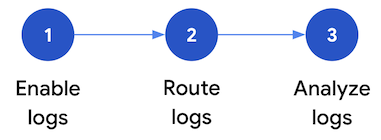
- **Enable logs:** There are many security logs available in
Google Cloud. Each log has different information that can be useful in
answering specific security questions. Some logs like Admin Activity audit logs
are enabled by default; others need to be manually enabled because they incur
additional ingestion costs in Cloud Logging. Therefore, the first step in
the workflow is to prioritize the security logs that are most relevant for
your security analysis needs and to individually enable those specific logs.
To help you evaluate logs in terms of the visibility and threat detection
coverage they provide, this guide includes a [log scoping tool](https://docs.cloud.google.com/architecture/security-log-analytics#log_scoping_tool). This tool maps each log to relevant
threat tactics and techniques in the [MITRE ATT\&CK® Matrix for Enterprise](https://attack.mitre.org/matrices/enterprise/cloud/).
The tool also maps
[Event Threat Detection](https://docs.cloud.google.com/security-command-center/docs/concepts-event-threat-detection-overview)
rules in Security Command Center to the logs on which they rely. You can
use the log scoping tool to evaluate logs regardless of the analytics tool
that you use.
- **Route logs:** After identifying and enabling the logs to be
analyzed, the next step is to route and aggregate the logs from your
organization, including any contained folders, projects, and billing accounts.
How you route logs depends on the analytics tool that you use.
This guide describes common log routing destinations, and shows you
how to use a Cloud Logging [aggregated sink](https://docs.cloud.google.com/logging/docs/export/aggregated_sinks)
to route organization-wide logs into a Cloud Logging [log bucket](https://docs.cloud.google.com/logging/docs/routing/overview#buckets) or a BigQuery dataset depending on
whether you choose to use Observability Analytics or BigQuery for analytics.
- **Analyze logs:** After you route the logs into an analytics tool, the next
step is to perform an analysis of these logs to identify any
potential security threats. How you analyze the logs depends on the
analytics tool that you use. If you use Observability Analytics or BigQuery,
you can analyze the logs by using SQL queries. If you use Google Security Operations,
you analyze the logs by using [YARA-L rules](https://docs.cloud.google.com/chronicle/docs/detection/yara-l-2-0-overview).
If you are using a third-party SIEM tool, you use the query language
specified by that tool.
In this guide, you'll find SQL queries that you can use to analyze the
logs in either Observability Analytics or BigQuery. The SQL queries
provided in this guide come from the [Community Security Analytics (CSA)](https://github.com/GoogleCloudPlatform/security-analytics)
project. CSA is an open-source set of foundational security analytics
designed to provide you with a baseline of pre-built queries and rules that
you can reuse to start analyzing your Google Cloud logs.
The following sections provide detailed information on how to set up and apply
each step in the security logs analytics workflow.
## Enable logs
The process of enabling logs involves the following steps:
1. Identify the logs you need by using the log scoping tool in this guide.
2. Record the log filter generated by the log scoping tool for use later when configuring the log sink.
3. Enable logging for each identified log type or Google Cloud service. Depending on the service, you might have to also enable the corresponding Data Access audit logs as detailed later in this section.
### Identify logs using the log scoping tool
To help you identify the logs that meet your security and compliance needs, you
can use the log scoping tool shown in this section. This tool provides an
interactive table that lists valuable security-relevant logs across
Google Cloud including Cloud Audit Logs, Access Transparency logs, network logs,
and several platform logs. This tool maps each log type to the following areas:
- [MITRE ATT\&CK](https://attack.mitre.org/matrices/enterprise/cloud/) threat tactics and techniques that can be monitored with that log.
- [CIS Google Cloud Computing Platform](https://www.cisecurity.org/benchmark/google_cloud_computing_platform/) compliance violations that can be detected in that log.
- [Event Threat Detection](https://docs.cloud.google.com/security-command-center/docs/concepts-event-threat-detection-overview#rules) rules that rely on that log.
The log scoping tool also generates a log filter which appears immediately after
the table. As you identify the logs that you need, select those logs in
the tool to automatically update that log filter.
The following short procedures explain how to use the log scoping tool:
- To select or remove a log in the log scoping tool, click the toggle next to the name of the log.
- To select or remove all the logs, click the toggle next to the **Log
type** heading.
- To see which MITRE ATT\&CK techniques can be monitored by each log type, click next to the **MITRE ATT\&CK tactics and techniques** heading.
#### Log scoping tool
### Record the log filter
The log filter that is automatically generated by the log scoping tool contains
all of the logs that you have selected in the tool. You can use the filter as is
or you can refine the log filter further depending on your requirements. For
example, you can include (or exclude) resources only in one or more specific
projects. After you have a log filter that meets your logging requirements, you
need to save the filter for use when routing the logs. For instance, you can
save the filter in a text editor or save it in an environment variable as
follows:
1. In the "Auto-generated log filter" section that follows the tool, copy the code for the log filter.
2. Optional: Edit the copied code to refine the filter.
3. In [Cloud Shell](https://docs.cloud.google.com/shell/docs/launching-cloud-shell), create a variable to
save the log filter:
export LOG_FILTER='LOG_FILTER'
Replace `LOG_FILTER` with the code for the log filter.
### Enable service-specific platform logs
For each of the platform logs that you select in the log scoping tool, those
logs must be enabled (typically at the resource level) on a service-by-service
basis. For example, Cloud DNS logs are enabled at the VPC-network level.
Likewise, VPC Flow Logs are enabled at the subnet level for all VMs in the
subnet, and logs from Firewall Rules Logging are enabled at the
individual firewall rule level.
Each platform log has its own instructions on how to enable logging. However,
you can use the log scoping tool to quickly open the relevant instructions for
each platform log.
To learn how to enable logging for a specific platform log, do the following:
1. In the log scoping tool, locate the platform log that you want to enable.
2. In the **Enabled by default** column, click the **Enable** link that corresponds to that log. The link takes you to detailed instructions on how to enable logging for that service.
### Enable the Data Access audit logs
As you can see in the log scoping tool, the Data Access audit logs from
Cloud Audit Logs provide broad threat detection coverage. However, their
volume can be quite large. Enabling these Data Access audit logs might therefore
result in additional charges related to ingesting, storing, exporting, and
processing these logs. This section both explains how to enable these logs and
presents some best practices to help you with making the tradeoff between value
and cost.
> [!NOTE]
> **Note:** Data Access audit logs might contain personally identifiable information (PII) like caller identities and IP addresses. You must apply the appropriate access control and retention settings available in your analytics tool to secure your log data, retain that data only as long as needed, and then dispose of that data securely.
Data Access audit logs---except for BigQuery---are disabled by default. To
configure Data Access audit logs for Google Cloud services other than
BigQuery, you must explicitly enable them either by [using the Google Cloud console](https://docs.cloud.google.com/logging/docs/audit/configure-data-access#config-console)
or by [using the Google Cloud CLI](https://docs.cloud.google.com/logging/docs/audit/configure-data-access#config-api) to edit
Identity and Access Management (IAM) policy objects. When you enable Data Access
audit logs, you can also configure which types of operations are recorded.
There are three Data Access audit log types:
- `ADMIN_READ`: Records operations that read metadata or configuration information.
- `DATA_READ`: Records operations that read user-provided data.
- `DATA_WRITE`: Records operations that write user-provided data.
Note that you can't configure the recording of `ADMIN_WRITE` operations, which
are operations that write metadata or configuration information. `ADMIN_WRITE`
operations are included in Admin Activity audit logs from Cloud Audit Logs
and therefore can't be disabled.
> [!TIP]
> **Best Practice**: Enable Data Access audit logs at the folder or organization level to ensure compliance across all child projects of that folder or organization. When you enable the audit logs at the folder or organization level, the audit policy applies to all existing and new projects in that folder or organization. That audit policy cannot be disabled at the project level.
#### Manage the volume of Data Access audit logs
When enabling Data Access audit logs, the goal is to maximize their value in
terms of security visibility while also limiting their cost and management
overhead. To help you achieve that goal, we recommend that you do the following
to filter out low-value, high-volume logs:
- **Prioritize relevant services** such as services that host sensitive workloads, keys and data. For specific examples of services that you might want to prioritize over others, see [Example Data Access audit log configuration](https://docs.cloud.google.com/architecture/security-log-analytics#example_data_access_audit_config).
- **Prioritize relevant projects** such as projects that host production
workloads as opposed to projects that host developer and staging environments.
To filter out all logs from a particular project, add the following expression
to your log filter for your sink. Replace PROJECT_ID with the ID of
the project from which you want to filter out all logs:
| Project | Log filter expression |
|---|---|
| Exclude all logs from a given project | ```sql NOT logName =~ "^projects/PROJECT_ID" ``` |
- **Prioritize a subset of data access operations** such as `ADMIN_READ`,
`DATA_READ`, or `DATA_WRITE` for a minimal set of recorded operations. For
example, some services like Cloud DNS write all three types of operations,
but you can enable logging for only `ADMIN_READ` operations. After you have
configured one of more of these three types of data access operations, you
might want to exclude specific operations that are particularly high volume.
You can exclude these high volume operations by modifying the sink's log
filter. For example, you decide to enable full Data Access audit logging,
including `DATA_READ` operations on some critical storage services. To exclude
specific high-traffic data read operations in this situation, you can add the
following recommended log filter expressions to your sink's log filter:
| Service | Log filter expression |
|---|---|
| Exclude high volume logs from Cloud Storage | ```sql NOT (resource.type="gcs_bucket" AND (protoPayload.methodName="storage.buckets.get" OR protoPayload.methodName="storage.buckets.list")) ``` |
| Exclude high volume logs from Cloud SQL | ```sql NOT (resource.type="cloudsql_database" AND protoPayload.request.cmd="select") ``` |
- **Prioritize relevant resources** such as resources that host your most
sensitive workloads and data. You can classify your resources based on the
value of the data that they process, and their security risk such as whether
they are externally accessible or not. Although Data Access audit logs are
enabled per service, you can filter out specific resources or resource types
through the log filter.
- **Exclude specific principals** from having their data accesses recorded.
For example, you can exempt your internal testing accounts from having their
operations recorded. To learn more, see [Set exemptions](https://docs.cloud.google.com/logging/docs/audit/configure-data-access#config-console-exempt) in Data Access
audit logs documentation.
> [!NOTE]
> **Note:** In addition to using the sink's log filter to filter out the additional logs as discussed in this section, you might want to exclude these logs from being ingested into Cloud Logging for cost reasons. To prevent these logs from being ingested, you can apply the log filter expressions listed in this section as [exclusion filters](https://docs.cloud.google.com/logging/docs/routing/overview#exclusions) on the predefined `_Default` sink that routes logs (including Data Access audit logs) to the [`_Default` log bucket](https://docs.cloud.google.com/logging/docs/routing/overview#default-bucket). Exclusion filters have the opposite effect of a log filter, which is an inclusion filter. Thus when configuring these expressions as exclusion filters, you need to remove the preceding `NOT` Boolean operator from the filter expressions that are shown in this section.
#### Example Data Access audit log configuration
The following table provides a baseline Data Access audit log configuration
that you can use for Google Cloud projects to limit log volumes while
gaining valuable security visibility:
| Tier | Services | Data Access audit log types | MITRE ATT\&CK tactics |
|---|---|---|---|
| Authentication \& authorization services | IAM Identity-Aware Proxy (IAP)^1^ Cloud KMS Secret Manager Resource Manager | ADMIN_READ DATA_READ | Discovery Credential Access Privilege Escalation |
| Storage services | BigQuery (enabled by default) Cloud Storage^1, 2^ | DATA_READ DATA_WRITE | Collection Exfiltration |
| Infrastructure services | Compute Engine Organization Policy | ADMIN_READ | Discovery |
^1^ Enabling Data Access audit logs for IAP or
Cloud Storage can generate large log volumes when there is high traffic
to IAP-protected web resources or to Cloud Storage
objects.
^2^ Enabling Data Access audit logs for Cloud Storage might
break the use of [authenticated browser downloads](https://docs.cloud.google.com/storage/docs/request-endpoints#cookieauth) for non-public
objects. For more details and suggested workarounds to this issue, see the
[Cloud Storage troubleshooting
guide](https://docs.cloud.google.com/storage/docs/troubleshooting#trouble-download-storage-cloud).
In the example configuration, notice how services are grouped in tiers of
sensitivity based on their underlying data, metadata, or configuration. These
tiers demonstrate the following recommended granularity of Data Access audit
logging:
- Authentication \& authorization services: For this tier of services, we recommend auditing all data access operations. This level of auditing helps you monitor access to your sensitive keys, secrets, and IAM policies. Monitoring this access might help you detect MITRE ATT\&CK tactics like [Discovery](https://attack.mitre.org/tactics/TA0007/), [Credential Access](https://attack.mitre.org/tactics/TA0006/), and [Privilege Escalation](https://attack.mitre.org/tactics/TA0004/).
- Storage services: For this tier of services, we recommend auditing data access operations that involve user-provided data. This level of auditing helps you monitor access to your valuable and sensitive data. Monitoring this access might help you detect MITRE ATT\&CK tactics like [Collection](https://attack.mitre.org/tactics/TA0009/) and [Exfiltration](https://attack.mitre.org/tactics/TA0010/) against your data.
- Infrastructure services: For this tier of services, we recommend auditing data access operations that involve metadata or configuration information. This level of auditing helps you monitor for scanning of infrastructure configuration. Monitoring this access might help you detect MITRE ATT\&CK tactics like [Discovery](https://attack.mitre.org/tactics/TA0007/) against your workloads.
## Route logs
After the logs are identified and enabled, the next step is to route the logs to
a single destination. The routing destination, path and complexity vary depending
on the analytics tools that you use, as shown in the following diagram.
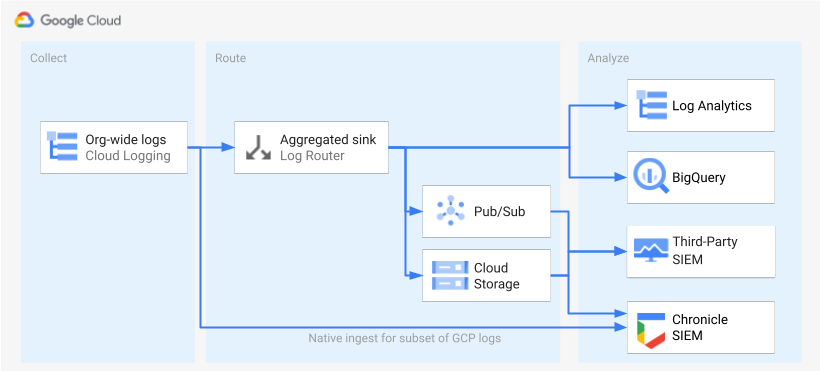
The diagram shows the following routing options:
- If you use Observability Analytics, you need an [aggregated sink](https://docs.cloud.google.com/logging/docs/export/aggregated_sinks)
to aggregate the logs from across your Google Cloud organization into a single Cloud Logging bucket.
- If you use BigQuery, you need an aggregated sink to aggregate the logs
from across your Google Cloud organization into a single BigQuery dataset.
- If you use Google Security Operations and this [predefined subset of logs](https://docs.cloud.google.com/chronicle/docs/ingestion/cloud/ingest-gcp-logs#export-logs)
meets your security analysis needs, you can automatically aggregate these logs
into your Google Security Operations account using the built-in Google Security Operations
ingest. You can also view this predefined set of logs by looking at the
**Exportable directly to Google Security Operations** column of the log scoping tool.
For more information about exporting these predefined logs, see
[Ingest Google Cloud logs to Google Security Operations](https://docs.cloud.google.com/chronicle/docs/ingestion/cloud/ingest-gcp-logs).
- If you use BigQuery or a third-party SIEM or want to export an
expanded set of logs into Google Security Operations, the diagram shows that an
additional step is needed between enabling the logs and analyzing them. This
additional step consists of configuring an aggregated sink that routes the
selected logs appropriately. If you're using BigQuery, this sink
is all that you need to route the logs to BigQuery. If you're using a
third-party SIEM, you need to have the sink aggregate the selected logs in
Pub/Sub or Cloud Storage before the logs can be pulled into
your analytics tool.
> [!NOTE]
> **Note:** If you use Observability Analytics (or BigQuery) and have already configured an aggregated sink to store logs in a central Logging bucket (or a central BigQuery dataset), you can skip this section of the guide and instead just update the sink with the log filter from the previous section. In the case of Observability Analytics, make sure to upgrade your existing [log bucket to use Observability Analytics](https://docs.cloud.google.com/logging/docs/buckets#upgrade-bucket).
The routing options to Google Security Operations and a third-party SIEM aren't covered
in this guide. However, the following sections provide the detailed steps
to route logs to Observability Analytics or BigQuery:
1. Set up a single destination
2. Create an aggregated log sink.
3. Grant access to the sink.
4. Configure read access to the destination.
5. Verify that the logs are routed to the destination.
### Set up a single destination
### Observability Analytics
> [!NOTE]
> **Note:** You can skip this step if you use a Cloud Logging bucket that already exists in the Google Cloud project where you want to aggregate the logs. You can use the `_Default` bucket, but we recommend that you create a separate bucket for this use case.
1. Open the Google Cloud console in the Google Cloud project that you want to
aggregate logs into.
[Go to Google Cloud console](https://console.cloud.google.com/)
2. In a [Cloud Shell](https://docs.cloud.google.com/shell/docs/launching-cloud-shell) terminal, run the
following `gcloud` command to create a log bucket:
gcloud logging buckets create BUCKET_NAME \
--location=BUCKET_LOCATION \
--project=PROJECT_ID
Replace the following:
- `PROJECT_ID`: the ID of the Google Cloud project where the aggregated logs will be stored.
- `BUCKET_NAME`: the name of the new Logging bucket.
- `BUCKET_LOCATION`: the geographical location of the
new Logging bucket. The supported locations are `global`,
`us`, or `eu`. To learn more about these storage regions, refer to
[Supported regions](https://docs.cloud.google.com/logging/docs/regionalized-logs#other).
If you don't specify a location, then the `global` region is used, which
means that the logs could be physically located in any of the regions.
> [!NOTE]
> **Note:** After you create your bucket, you can't change your bucket's region.
3. Verify that the bucket was created:
gcloud logging buckets list --project=PROJECT_ID
4. (Optional) Set the retention period of the logs in the bucket. The
following example extends the retention of logs stored in the bucket to
365 days:
gcloud logging buckets update BUCKET_NAME \
--location=BUCKET_LOCATION \
--project=PROJECT_ID \
--retention-days=365
5. Upgrade your new bucket to use Observability Analytics by [following these steps](https://docs.cloud.google.com/logging/docs/buckets#upgrade-bucket).
### BigQuery
1. Open the Google Cloud console in the Google Cloud project that you want to
aggregate logs into.
[Go to Google Cloud console](https://console.cloud.google.com/)
2. In a [Cloud Shell](https://docs.cloud.google.com/shell/docs/launching-cloud-shell) terminal, run the
following `bq mk` command to create a dataset:
bq --location=DATASET_LOCATION mk \
--dataset \
--default_partition_expiration=PARTITION_EXPIRATION \
PROJECT_ID:DATASET_ID
Replace the following:
- `PROJECT_ID`: the ID of the Google Cloud project where the aggregated logs will be stored.
- `DATASET_ID`: the ID of the new BigQuery dataset.
- `DATASET_LOCATION`: the geographic location of the
dataset. After a dataset is created, the location can't be changed.
> [!NOTE]
> **Note:** If you choose **EU** or an EU-based region for the dataset location, your Core BigQuery Customer Data resides in the EU. Core BigQuery Customer Data is defined in the [Service
> Specific Terms](https://cloud.google.com/terms/service-terms#13-google-bigquery-service).
- `PARTITION_EXPIRATION`: the default lifetime (in seconds) for
the partitions in the partitioned tables that are created by the log sink.
You configure the log sink in the next section. The log sink that you
configure uses partitioned tables that are partitioned by day based on
the log entry's timestamp. Partitions (including associated log entries)
are deleted `PARTITION_EXPIRATION` seconds after the
partition's date.
> [!TIP]
> **Best Practice** : Set the [default partition expiration](https://docs.cloud.google.com/bigquery/docs/updating-datasets#partition-expiration) property of the dataset based on your log retention requirements so older logs age out and expire. You can do so during or after you create the dataset. This allows you to retain logs as long as needed, while limiting the total size of the log storage and associated cost. If you have more granular retention requirements based on the log type, you can override this property at the table level *after* the log sink has started routing logs and has created their corresponding partitioned tables. For example, you might be required to keep Cloud Audit Logs data for three years, but VPC Flow Logs and Firewall Rules Logs need only be retained for 90 days. If you do not set a default partition expiration at the dataset level, and you do not set a partition expiration when the table is created, the partitions never expire
### Create an aggregated log sink
You route your organization logs into your destination by creating an aggregated
sink at the organization level. To include all the logs you selected in the log scoping tool,
you configure the sink with the log filter generated by the log scoping tool.
> [!NOTE]
> **Note:** Routing logs to this new destination doesn't mean that your logs are redirected to it. Instead, your logs are stored twice: once in their parent Google Cloud project and then again in the new destination. To avoid this duplicate storage of your logs, add an [exclusion filter](https://docs.cloud.google.com/logging/docs/routing/overview#excusions) to the `_Default` sink of every child Google Cloud project in your organization. To stop logs from being ingested into the `_Default` sinks of *future* Google Cloud projects in your organization, [disable the `_Default` sink](https://docs.cloud.google.com/logging/docs/default-settings#disable-default-sink) in the default settings of your organization.
### Observability Analytics
1. In a [Cloud Shell](https://docs.cloud.google.com/shell/docs/launching-cloud-shell) terminal, run
the following `gcloud` command to create an aggregated sink at the organization
level:
gcloud logging sinks create SINK_NAME \
logging.googleapis.com/projects/PROJECT_ID/locations/BUCKET_LOCATION/buckets/BUCKET_NAME \
--log-filter="LOG_FILTER" \
--organization=ORGANIZATION_ID \
--include-children
Replace the following:
- `SINK_NAME`: the name of the sink that routes the logs.
- `PROJECT_ID`: the ID of the Google Cloud project where the aggregated logs will be stored.
- `BUCKET_LOCATION`: the location of the Logging bucket that you created for log storage.
- `BUCKET_NAME`: the name of the Logging bucket that you created for log storage.
- `LOG_FILTER`: the log filter that you saved from the log scoping tool.
- `ORGANIZATION_ID`: the resource ID for your organization.
The `--include-children` flag is important so that logs from all the
Google Cloud projects within your organization are also included. For more
information, see
[Collate and route organization-level logs to supported destinations](https://docs.cloud.google.com/logging/docs/export/aggregated_sinks).
2. Verify the sink was created:
gcloud logging sinks list --organization=ORGANIZATION_ID
3. Get the name of the service account associated with the sink that you just created:
gcloud logging sinks describe SINK_NAME --organization=ORGANIZATION_ID
The output looks similar to the following:
writerIdentity: serviceAccount:p1234567890-12345@logging-o1234567890.iam.gserviceaccount.com`
4. Copy the entire string for `writerIdentity` starting with **serviceAccount:**.
This identifier is the sink's service account. Until you grant this
service account write access to the log bucket, log routing from this sink
will fail. You grant write access to the sink's writer identity in the
next section.
### BigQuery
1. In a [Cloud Shell](https://docs.cloud.google.com/shell/docs/launching-cloud-shell) terminal, run the
following `gcloud` command to create an aggregated sink at the organization level:
gcloud logging sinks create SINK_NAME \
bigquery.googleapis.com/projects/PROJECT_ID/datasets/DATASET_ID \
--log-filter="LOG_FILTER" \
--organization=ORGANIZATION_ID \
--use-partitioned-tables \
--include-children
Replace the following:
- `SINK_NAME`: the name of the sink that routes the logs.
- `PROJECT_ID`: the ID for the Google Cloud project you want to aggregate the logs into.
- `DATASET_ID`: the ID of the BigQuery dataset you created.
- `LOG_FILTER`: the log filter that you saved from the log scoping tool.
- `ORGANIZATION_ID`: the resource ID for your organization.
The `--include-children` flag is important so that logs from all the
Google Cloud projects within your organization are also included. For more
information, see
[Collate and route organization-level logs to supported destinations](https://docs.cloud.google.com/logging/docs/export/aggregated_sinks).
The `--use-partitioned-tables` flag is important so that data is partitioned
by day based on the log entry's `timestamp` field. This simplifies querying
of the data and helps reduce query costs by reducing the amount of data
scanned by queries. Another benefit of partitioned tables is that you can
[set a default partition expiration](https://docs.cloud.google.com/bigquery/docs/updating-datasets#partition-expiration) at the dataset level to meet your log
retention requirements. You have already set a default partition expiration
when you created the dataset destination in the previous section. You might
also choose to [set a partition expiration](https://docs.cloud.google.com/bigquery/docs/managing-partitioned-tables#partition-expiration) at the
individual table level, providing you with fine-grained data retention
controls based on log type.
2. Verify the sink was created:
gcloud logging sinks list --organization=ORGANIZATION_ID
3. Get the name of the service account associated with the sink that you just created:
gcloud logging sinks describe SINK_NAME --organization=ORGANIZATION_ID
The output looks similar to the following:
writerIdentity: serviceAccount:p1234567890-12345@logging-o1234567890.iam.gserviceaccount.com`
4. Copy the entire string for `writerIdentity` starting with **serviceAccount:**.
This identifier is the sink's service account. Until you grant this
service account write access to the BigQuery dataset,
log routing from this sink will fail. You grant write access to the sink's
writer identity in the next section.
### Grant access to the sink
After creating the log sink, you must grant your sink access to write to its
destination, be it the Logging bucket or the BigQuery
dataset.
> [!NOTE]
> **Note:** To route logs to a resource protected by a [service perimeter](https://docs.cloud.google.com/vpc-service-controls/docs/service-perimeters#about-perimeters), you must also add the service account for that sink to an access level and then assign it to the destination service perimeter. This isn't necessary for non-aggregated sinks. For details, see [VPC Service Controls: Cloud Logging](https://docs.cloud.google.com/vpc-service-controls/docs/supported-products#logging).
### Observability Analytics
To add the permissions to the sink's service account, follow these steps:
1. In the Google Cloud console, go to the IAM page:
[Go to the IAM page](https://console.cloud.google.com/iam-admin/iam)
2. Make sure that you've selected the destination Google Cloud project that
contains the Logging bucket you created for central log storage.
3. Click
**Grant access**.
4. In the **New principals** field, enter the sink's service account without
the `serviceAccount:` prefix. Recall that this identity comes from
the `writerIdentity` field you retrieved in the previous section after you
created the sink.
5. In the **Select a role** drop-down menu, select **Logs Bucket Writer**.
6. Click **Add IAM condition** to restrict the service account's
access to only the log bucket you created.
7. Enter a **Title** and **Description** for the condition.
8. In the **Condition type** drop-down menu, select **Resource** \> **Name**.
9. In the **Operator** drop-down menu, select **Ends with**.
10. In the **Value** field, enter the bucket's location and name as follows:
locations/BUCKET_LOCATION/buckets/BUCKET_NAME
11. Click **Save** to add the condition.
12. Click **Save** to set the permissions.
### BigQuery
To add the permissions to the sink's service account, follow these steps:
1. In the Google Cloud console, go to BigQuery:
[Go to BigQuery](https://bigquery.cloud.google.com)
2. Open the BigQuery dataset that you created for central log storage.
3. In the Dataset info tab, click the **Sharing**
drop-down menu, and then click **Permissions**.
4. In the Dataset Permissions side panel, click **Add Principal**.
5. In the **New principals** field, enter the sink's service account without
the `serviceAccount:` prefix. Recall that this identity comes from
the `writerIdentity` field you retrieved in the previous section after you
created the sink.
6. In the **Role** drop-down menu, select **BigQuery Data Editor**.
7. Click **Save**.
After you grant access to the sink, log entries begin to populate the sink
destination: the Logging bucket or the BigQuery dataset.
### Configure read access to the destination
Now that your log sink routes logs from your entire organization into one single
destination, you can search across all of these logs. Use IAM
permissions to manage permissions and grant access as needed.
### Observability Analytics
To grant access to view and query the logs in your new log bucket, follow these steps.
1. In the Google Cloud console, go to the IAM page:
[Go to the IAM page](https://console.cloud.google.com/iam-admin/iam)
Make sure you've selected the Google Cloud project you're using to
aggregate the logs.
2. Click
**Add**.
3. In the **New principal** field, add your email account.
4. In the **Select a role** drop-down menu, select **Logs Views Accessor**.
This role provides the newly added principal with read access to all views
for any buckets in the Google Cloud project. To limit a user's access,
add a condition that lets the user read only from your new bucket only.
1. Click **Add condition**.
2. Enter a **Title** and **Description** for the condition.
3. In the **Condition type** drop-down menu, select **Resource** \> **Name**.
4. In the **Operator** drop-down menu, select **Ends with**.
5. In the **Value** field, enter the bucket's location and name,
and the default log view `_AllLogs` as follows:
locations/BUCKET_LOCATION/buckets/BUCKET_NAME/views/_AllLogs
> [!NOTE]
> **Note:** Cloud Logging automatically creates the `_AllLogs` view for every bucket, which shows all the logs in the bucket. For more granular control over which logs can be viewed and queried within that log bucket, you can create and use a [custom log view](https://docs.cloud.google.com/logging/docs/logs-views#create_view) instead of `_AllLogs`.
6. Click **Save** to add the condition.
5. Click **Save** to set the permissions.
### BigQuery
To grant access to view and query the logs in your BigQuery dataset,
follow the steps in the [Granting access to a dataset](https://docs.cloud.google.com/bigquery/docs/dataset-access-controls#granting_access_to_a_dataset) section of the
BigQuery documentation.
### Verify that the logs are routed to the destination
### Observability Analytics
When you route logs to a log bucket upgraded to Observability Analytics, you can
view and query all log entries through a single log view with a unified schema
for all log types. Follow these steps to verify the logs are correctly routed.
1. In the Google Cloud console, go to Observability Analytics page:
[Go to Observability Analytics](https://console.cloud.google.com/logs/analytics)
Make sure you've selected the Google Cloud project you're using to
aggregate the logs.
2. Click on **Log Views** tab.
3. Expand the log views under the log bucket that you have created (that is
`BUCKET_NAME`) if it is not expanded
already.
4. Select the default log view `_AllLogs`. You can now inspect the entire log
schema in the right panel, as shown in the following screenshot:
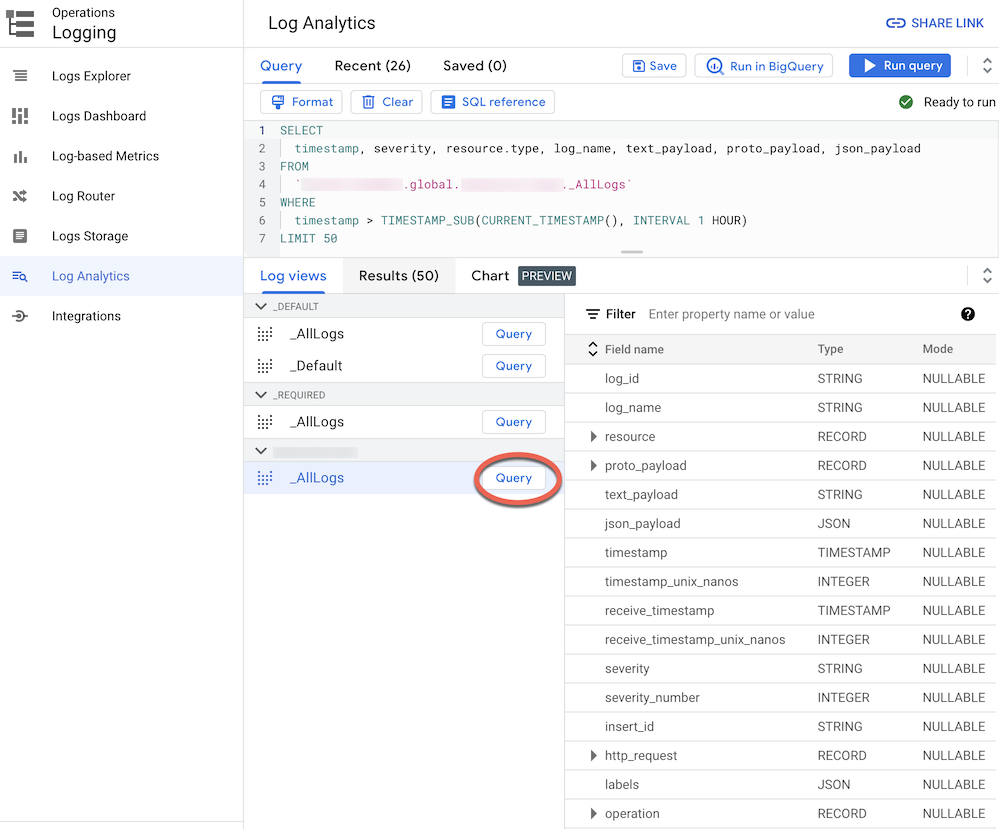
5. Next to `_AllLogs`, click **Query** . This populates the **Query** editor
with a SQL sample query to retrieve recently routed log entries.
6. Click **Run query** to view recently routed log entries.
Depending on level of activity in Google Cloud projects in your organization,
you might have to wait a few minutes until some logs get generated, and then
routed to your log bucket.
### BigQuery
When you route logs to a BigQuery dataset, Cloud Logging
creates BigQuery tables to hold the log entries as shown
in the following screenshot:

The screenshot shows how Cloud Logging names each BigQuery
table based on the name of the log to which a log entry belongs. For example,
the `cloudaudit_googleapis_com_data_access` table that is selected in the
screenshot contains Data Access audit logs whose log ID is
`cloudaudit.googleapis.com%2Fdata_access`. In addition to being named based on
the corresponding log entry, each table is also partitioned based on the
timestamps for each log entry.
Depending on level of activity in Google Cloud projects in your organization,
you might have to wait a few minutes until some logs get generated, and then
routed to your BigQuery dataset.
> [!NOTE]
> **Note:** Both Admin Activity and Data Access logs are loaded into BigQuery with their `protoPayload` log entry field renamed to `protoPayload_auditlog` in BigQuery. For more information about schema conversions done by Cloud Logging before writing to BigQuery, see [Fields in exported audit logs](https://docs.cloud.google.com/logging/docs/export/bigquery#audit-logs).
## Analyze logs
You can run a broad range of queries against your audit and platform logs. The
following list provides a set of sample security questions that you might want to
ask of your own logs. For each question in this list, there are two versions of
the corresponding CSA query: one for use with Observability Analytics and one for use
with BigQuery. Use the query version that matches the sink destination
that you previously set up.
### Observability Analytics
Before using any of the SQL queries below, replace `MY_PROJECT_ID`
with the ID of the Google Cloud project where you created the log bucket (that is `PROJECT_ID)`, and `MY_DATASET_ID` with the region and name of that log bucket (that is
`BUCKET_LOCATION.BUCKET_NAME`).
[Go to Observability Analytics](https://console.cloud.google.com/logs/analytics)
### BigQuery
Before using any of the SQL queries below, replace `MY_PROJECT_ID`
with the ID of the Google Cloud project where you created the BigQuery dataset (that is `PROJECT_ID)`, and `MY_DATASET_ID` with the name of that dataset, that is `DATASET_ID`.
[Go to BigQuery](https://console.cloud.google.com/bigquery)
1. [Login and access questions](https://docs.cloud.google.com/architecture/security-log-analytics#login_and_access_questions)
- [Any suspicious login attempt flagged by Google Workspace?](https://docs.cloud.google.com/architecture/security-log-analytics#1_02_suspicious_login_attempt)
- [Any excessive login failures from any user identity?](https://docs.cloud.google.com/architecture/security-log-analytics#1_03_excessive_login_failures)
- [Any access attempts violating VPC Service Controls?](https://docs.cloud.google.com/architecture/security-log-analytics#1_10_access_attempts_blocked_by_VPC_SC)
- [Any access attempts violating Identity-Aware Proxy access controls?](https://docs.cloud.google.com/architecture/security-log-analytics#1_20_access_attempts_blocked_by_IAP)
2. [Permission changes questions](https://docs.cloud.google.com/architecture/security-log-analytics#permission_changes_questions)
- [Any user added to highly-privileged groups?](https://docs.cloud.google.com/architecture/security-log-analytics#2_02_user_added_to_privileged_group)
- [Any permissions granted over a service account?](https://docs.cloud.google.com/architecture/security-log-analytics#2_20_permissions_granted_over_SA)
- [Any service accounts or keys created by non-approved identity?](https://docs.cloud.google.com/architecture/security-log-analytics#2_30_service_accounts_or_keys_created_by_non_approved_identity)
- [Any user added to (or removed from) sensitive IAM policy?](https://docs.cloud.google.com/architecture/security-log-analytics#2_40_user_access_modified_in_IAP)
3. [Provisioning activity questions](https://docs.cloud.google.com/architecture/security-log-analytics#provisioning_activity_questions)
- [Any changes made to logging settings?](https://docs.cloud.google.com/architecture/security-log-analytics#3_01_logging_settings_modified)
- [Any VPC Flow Logs disabled?](https://docs.cloud.google.com/architecture/security-log-analytics#3_02_vpc_flows_logging_disabled)
- [Any unusual number of firewall rules modified in the past week?](https://docs.cloud.google.com/architecture/security-log-analytics#3_11_unusual_number_of_firewall_rules_modified)
- [Any VMs deleted in the past week?](https://docs.cloud.google.com/architecture/security-log-analytics#3_20_virtual_machines_deleted)
4. [Workload usage questions](https://docs.cloud.google.com/architecture/security-log-analytics#workload_usage_questions)
- [Any unusually high API usage by any user identity in the past week?](https://docs.cloud.google.com/architecture/security-log-analytics#4_01_unusually_high_api_usage_by_user_identity)
- [What is the autoscaling usage per day in the past month?](https://docs.cloud.google.com/architecture/security-log-analytics#4_11_autoscaling_usage_frequency_by_day)
5. [Data access questions](https://docs.cloud.google.com/architecture/security-log-analytics#data_access_questions)
- [Which users most frequently accessed data in the past week?](https://docs.cloud.google.com/architecture/security-log-analytics#5_01_users_who_most_frequently_accessed_data)
- [Which users accessed the data in the "accounts" table last month?](https://docs.cloud.google.com/architecture/security-log-analytics#5_04_users_who_accessed_data_in_table)
- [What tables are most frequently accessed and by whom?](https://docs.cloud.google.com/architecture/security-log-analytics#5_05_tables_most_frequently_accessed)
- [What are the top 10 queries against BigQuery in the past week?](https://docs.cloud.google.com/architecture/security-log-analytics#5_06_BQ_queries_top)
- [What are the most common actions recorded in the data access log over the past month?](https://docs.cloud.google.com/architecture/security-log-analytics#5_20_top_data_access_actions)
6. [Network security questions](https://docs.cloud.google.com/architecture/security-log-analytics#network_security_questions)
- [Any connections from a new IP address to a specific subnetwork?](https://docs.cloud.google.com/architecture/security-log-analytics#6_10_connection_from_new_IP)
- [Any connections blocked by Google Cloud Armor?](https://docs.cloud.google.com/architecture/security-log-analytics#6_20_connections_blocked_by_cloud_armor)
- [Any high-severity virus or malware detected by Cloud IDS?](https://docs.cloud.google.com/architecture/security-log-analytics#6_30_virus_or_malware_detected_by_cloud_IDS)
- [What are the top Cloud DNS queried domains from your VPC network?](https://docs.cloud.google.com/architecture/security-log-analytics#6_40_DNS_top_queried_domains)
### Login and access questions
These sample queries perform analysis to detect suspicious login attempts
or initial access attempts to your Google Cloud environment.
> [!NOTE]
> **Note:** Login activity is captured in Cloud Identity logs that are included in [Google Workspace Login Audit](https://cloud.google.com/logging/docs/audit/gsuite-audit-logging#2). To analyze login activity and use some of the queries in this section, you need to enable Google Workspace data sharing with Google Cloud. To learn more about sharing Google Workspace audit logs with Google Cloud, see [View and manage audit logs for Google Workspace](https://docs.cloud.google.com/logging/docs/audit/configure-gsuite-audit-logs).
#### Any suspicious login attempt flagged by Google Workspace?
By searching Cloud Identity logs that are part of
[Google Workspace Login Audit](https://developers.google.com/admin-sdk/reports/v1/appendix/activity/login),
the following query detects suspicious login attempts flagged by Google Workspace.
Such login attempts might be from the Google Cloud console, Admin console,
or the gcloud CLI.
### Observability Analytics
SELECT
timestamp,
proto_payload.audit_log.authentication_info.principal_email,
proto_payload.audit_log.request_metadata.caller_ip,
proto_payload.audit_log.method_name, parameter
FROM `[MY_PROJECT_ID].[MY_LOG_BUCKET_REGION].[MY_LOG_BUCKET_NAME]._AllLogs`,
UNNEST(JSON_QUERY_ARRAY(proto_payload.audit_log.metadata.event[0].parameter)) AS parameter
WHERE
timestamp >= TIMESTAMP_SUB(CURRENT_TIMESTAMP(), INTERVAL 60 DAY)
AND proto_payload.audit_log IS NOT NULL
AND proto_payload.audit_log.service_name = "login.googleapis.com"
AND proto_payload.audit_log.method_name = "google.login.LoginService.loginSuccess"
AND JSON_VALUE(parameter.name) = "is_suspicious"
AND JSON_VALUE(parameter.boolValue) = "true"
### BigQuery
SELECT
timestamp,
protopayload_auditlog.authenticationInfo.principalEmail,
protopayload_auditlog.requestMetadata.callerIp,
protopayload_auditlog.methodName
FROM `[MY_PROJECT_ID].[MY_DATASET_ID].cloudaudit_googleapis_com_data_access`,
UNNEST(JSON_QUERY_ARRAY(protopayload_auditlog.metadataJson, '$.event[0].parameter')) AS parameter
WHERE
timestamp >= TIMESTAMP_SUB(CURRENT_TIMESTAMP(), INTERVAL 60 DAY)
AND protopayload_auditlog.metadataJson IS NOT NULL
AND protopayload_auditlog.serviceName = "login.googleapis.com"
AND protopayload_auditlog.methodName = "google.login.LoginService.loginSuccess"
AND JSON_VALUE(parameter, '$.name') = "is_suspicious"
AND JSON_VALUE(parameter, '$.boolValue') = "true"
#### Any excessive login failures from any user identity?
By searching Cloud Identity logs that are part of
[Google Workspace Login Audit](https://developers.google.com/admin-sdk/reports/v1/appendix/activity/login),
the following query detects users who have had three or more successive login
failures within the last 24 hours.
### Observability Analytics
SELECT
proto_payload.audit_log.authentication_info.principal_email,
MIN(timestamp) AS earliest,
MAX(timestamp) AS latest,
count(*) AS attempts
FROM `[MY_PROJECT_ID].[MY_LOG_BUCKET_REGION].[MY_LOG_BUCKET_NAME]._AllLogs`
WHERE
timestamp >= TIMESTAMP_SUB(CURRENT_TIMESTAMP(), INTERVAL 1 DAY)
AND proto_payload.audit_log.service_name = "login.googleapis.com"
AND proto_payload.audit_log.method_name = "google.login.LoginService.loginFailure"
GROUP BY
1
HAVING
attempts >= 3
### BigQuery
SELECT
protopayload_auditlog.authenticationInfo.principalEmail,
MIN(timestamp) AS earliest,
MAX(timestamp) AS latest,
count(*) AS attempts
FROM
`[MY_PROJECT_ID].[MY_DATASET_ID].cloudaudit_googleapis_com_data_access`
WHERE
timestamp >= TIMESTAMP_SUB(CURRENT_TIMESTAMP(), INTERVAL 1 DAY)
AND protopayload_auditlog.serviceName="login.googleapis.com"
AND protopayload_auditlog.methodName="google.login.LoginService.loginFailure"
GROUP BY
1
HAVING
attempts >= 3
#### Any access attempts violating VPC Service Controls?
By analyzing Policy Denied audit logs from Cloud Audit Logs, the following
query detects access attempts blocked by VPC Service Controls. Any query results
might indicate potential malicious activity like access attempts from
unauthorized networks using stolen credentials.
### Observability Analytics
SELECT
timestamp,
log_name,
proto_payload.audit_log.authentication_info.principal_email,
proto_payload.audit_log.request_metadata.caller_ip,
proto_payload.audit_log.method_name,
proto_payload.audit_log.service_name,
JSON_VALUE(proto_payload.audit_log.metadata.violationReason) as violationReason,
IF(JSON_VALUE(proto_payload.audit_log.metadata.ingressViolations) IS NULL, 'ingress', 'egress') AS violationType,
COALESCE(
JSON_VALUE(proto_payload.audit_log.metadata.ingressViolations[0].targetResource),
JSON_VALUE(proto_payload.audit_log.metadata.egressViolations[0].targetResource)
) AS targetResource,
COALESCE(
JSON_VALUE(proto_payload.audit_log.metadata.ingressViolations[0].servicePerimeter),
JSON_VALUE(proto_payload.audit_log.metadata.egressViolations[0].servicePerimeter)
) AS servicePerimeter
FROM `[MY_PROJECT_ID].[MY_LOG_BUCKET_REGION].[MY_LOG_BUCKET_NAME]._AllLogs`
WHERE
timestamp >= TIMESTAMP_SUB(CURRENT_TIMESTAMP(), INTERVAL 30 DAY)
AND proto_payload.audit_log IS NOT NULL
AND JSON_VALUE(proto_payload.audit_log.metadata, '$."@type"') = 'type.googleapis.com/google.cloud.audit.VpcServiceControlAuditMetadata'
ORDER BY
timestamp DESC
LIMIT 1000
### BigQuery
SELECT
timestamp,
protopayload_auditlog.authenticationInfo.principalEmail,
protopayload_auditlog.requestMetadata.callerIp,
protopayload_auditlog.methodName,
protopayload_auditlog.serviceName,
JSON_VALUE(protopayload_auditlog.metadataJson, '$.violationReason') as violationReason,
IF(JSON_VALUE(protopayload_auditlog.metadataJson, '$.ingressViolations') IS NULL, 'ingress', 'egress') AS violationType,
COALESCE(
JSON_VALUE(protopayload_auditlog.metadataJson, '$.ingressViolations[0].targetResource'),
JSON_VALUE(protopayload_auditlog.metadataJson, '$.egressViolations[0].targetResource')
) AS targetResource,
COALESCE(
JSON_VALUE(protopayload_auditlog.metadataJson, '$.ingressViolations[0].servicePerimeter'),
JSON_VALUE(protopayload_auditlog.metadataJson, '$.egressViolations[0].servicePerimeter')
) AS servicePerimeter
FROM
`[MY_PROJECT_ID].[MY_DATASET_ID].cloudaudit_googleapis_com_policy`
WHERE
timestamp >= TIMESTAMP_SUB(CURRENT_TIMESTAMP(), INTERVAL 400 DAY)
AND JSON_VALUE(protopayload_auditlog.metadataJson, '$."@type"') = 'type.googleapis.com/google.cloud.audit.VpcServiceControlAuditMetadata'
ORDER BY
timestamp DESC
LIMIT 1000
#### Any access attempts violating IAP access controls?
By analyzing external Application Load Balancer logs, the following query detects
access attempts blocked by IAP. Any query results might
indicate an initial access attempt or vulnerability exploit attempt.
### Observability Analytics
SELECT
timestamp,
http_request.remote_ip,
http_request.request_method,
http_request.status,
JSON_VALUE(resource.labels.backend_service_name) AS backend_service_name,
http_request.request_url
FROM `[MY_PROJECT_ID].[MY_LOG_BUCKET_REGION].[MY_LOG_BUCKET_NAME]._AllLogs`
WHERE
timestamp >= TIMESTAMP_SUB(CURRENT_TIMESTAMP(), INTERVAL 30 DAY)
AND resource.type="http_load_balancer"
AND JSON_VALUE(json_payload.statusDetails) = "handled_by_identity_aware_proxy"
ORDER BY
timestamp DESC
### BigQuery
SELECT
timestamp,
httpRequest.remoteIp,
httpRequest.requestMethod,
httpRequest.status,
resource.labels.backend_service_name,
httpRequest.requestUrl,
FROM `[MY_PROJECT_ID].[MY_DATASET_ID].requests`
WHERE
timestamp >= TIMESTAMP_SUB(CURRENT_TIMESTAMP(), INTERVAL 30 DAY)
AND resource.type="http_load_balancer"
AND jsonpayload_type_loadbalancerlogentry.statusdetails = "handled_by_identity_aware_proxy"
ORDER BY
timestamp DESC
### Permission changes questions
These sample queries perform analysis over administrator activity that changes
permissions, including changes in IAM policies, groups and group
memberships, service accounts, and any associated keys. Such permission changes
might provide a high level of access to sensitive data or environments.
> [!NOTE]
> **Note:** Group changes are captured in [Google Workspace Admin Audit](https://docs.cloud.google.com/logging/docs/audit/gsuite-audit-logging#3). To analyze group changes activity and use some of the queries in this section, you need to enable Google Workspace data sharing with Google Cloud. To learn more about sharing Google Workspace audit logs with Google Cloud, see [View and manage audit logs for Google Workspace](https://docs.cloud.google.com/logging/docs/audit/configure-gsuite-audit-logs).
#### Any user added to highly-privileged groups?
By analyzing [Google Workspace Admin Audit](https://docs.cloud.google.com/logging/docs/audit/gsuite-audit-logging#3)
audit logs, the following query detects users who have been added to any of the
highly-privileged groups listed in the query. You use the regular expression in
the query to define which groups (such as `admin@example.com` or `prod@example.com`)
to monitor. Any query results might indicate a malicious or accidental privilege
escalation.
### Observability Analytics
SELECT
timestamp,
proto_payload.audit_log.authentication_info.principal_email,
proto_payload.audit_log.method_name,
proto_payload.audit_log.resource_name,
(SELECT JSON_VALUE(x.value)
FROM UNNEST(JSON_QUERY_ARRAY(proto_payload.audit_log.metadata.event[0].parameter)) AS x
WHERE JSON_VALUE(x.name) = "USER_EMAIL") AS user_email,
(SELECT JSON_VALUE(x.value)
FROM UNNEST(JSON_QUERY_ARRAY(proto_payload.audit_log.metadata.event[0].parameter)) AS x
WHERE JSON_VALUE(x.name) = "GROUP_EMAIL") AS group_email,
FROM `[MY_PROJECT_ID].[MY_LOG_BUCKET_REGION].[MY_LOG_BUCKET_NAME]._AllLogs`
WHERE
timestamp >= TIMESTAMP_SUB(CURRENT_TIMESTAMP(), INTERVAL 120 DAY)
AND proto_payload.audit_log.service_name = "admin.googleapis.com"
AND proto_payload.audit_log.method_name = "google.admin.AdminService.addGroupMember"
AND EXISTS(
SELECT * FROM UNNEST(JSON_QUERY_ARRAY(proto_payload.audit_log.metadata.event[0].parameter)) AS x
WHERE
JSON_VALUE(x.name) = "GROUP_EMAIL"
AND REGEXP_CONTAINS(JSON_VALUE(x.value), r'(admin|prod).*') -- Update regexp with other sensitive groups if applicable
)
### BigQuery
SELECT
timestamp,
protopayload_auditlog.authenticationInfo.principalEmail,
protopayload_auditlog.methodName,
protopayload_auditlog.resourceName,
(SELECT JSON_VALUE(x, '$.value')
FROM UNNEST(JSON_QUERY_ARRAY(protopayload_auditlog.metadataJson, '$.event[0].parameter')) AS x
WHERE JSON_VALUE(x, '$.name') = "USER_EMAIL") AS userEmail,
(SELECT JSON_VALUE(x, '$.value')
FROM UNNEST(JSON_QUERY_ARRAY(protopayload_auditlog.metadataJson, '$.event[0].parameter')) AS x
WHERE JSON_VALUE(x, '$.name') = "GROUP_EMAIL") AS groupEmail,
FROM `[MY_PROJECT_ID].[MY_DATASET_ID].cloudaudit_googleapis_com_activity`
WHERE
timestamp >= TIMESTAMP_SUB(CURRENT_TIMESTAMP(), INTERVAL 120 DAY)
AND protopayload_auditlog.serviceName = "admin.googleapis.com"
AND protopayload_auditlog.methodName = "google.admin.AdminService.addGroupMember"
AND EXISTS(
SELECT * FROM UNNEST(JSON_QUERY_ARRAY(protopayload_auditlog.metadataJson, '$.event[0].parameter')) AS x
WHERE
JSON_VALUE(x, '$.name') = 'GROUP_EMAIL'
AND REGEXP_CONTAINS(JSON_VALUE(x, '$.value'), r'(admin|prod).*') -- Update regexp with other sensitive groups if applicable
)
#### Any permissions granted over a service account?
By analyzing Admin Activity audit logs from Cloud Audit Logs, the following
query detects any permissions that have been granted to any principal over a
service account. Examples of permissions that might be granted are the ability
to impersonate that service account or create service account keys. Any query
results might indicate an instance of privilege escalation or a risk of
credentials leakage.
### Observability Analytics
SELECT
timestamp,
proto_payload.audit_log.authentication_info.principal_email as grantor,
JSON_VALUE(bindingDelta.member) as grantee,
JSON_VALUE(bindingDelta.role) as role,
proto_payload.audit_log.resource_name,
proto_payload.audit_log.method_name
FROM
`[MY_PROJECT_ID].[MY_LOG_BUCKET_REGION].[MY_LOG_BUCKET_NAME]._AllLogs`,
UNNEST(JSON_QUERY_ARRAY(proto_payload.audit_log.service_data.policyDelta.bindingDeltas)) AS bindingDelta
WHERE
timestamp >= TIMESTAMP_SUB(CURRENT_TIMESTAMP(), INTERVAL 400 DAY)
-- AND log_id = "cloudaudit.googleapis.com/activity"
AND (
(resource.type = "service_account"
AND proto_payload.audit_log.method_name LIKE "google.iam.admin.%.SetIAMPolicy")
OR
(resource.type IN ("project", "folder", "organization")
AND proto_payload.audit_log.method_name = "SetIamPolicy"
AND JSON_VALUE(bindingDelta.role) LIKE "roles/iam.serviceAccount%")
)
AND JSON_VALUE(bindingDelta.action) = "ADD"
-- Principal (grantee) exclusions
AND JSON_VALUE(bindingDelta.member) NOT LIKE "%@example.com"
ORDER BY
timestamp DESC
### BigQuery
SELECT
timestamp,
protopayload_auditlog.authenticationInfo.principalEmail as grantor,
bindingDelta.member as grantee,
bindingDelta.role,
protopayload_auditlog.resourceName,
protopayload_auditlog.methodName,
FROM
`[MY_PROJECT_ID].[MY_DATASET_ID].cloudaudit_googleapis_com_activity`,
UNNEST(protopayload_auditlog.servicedata_v1_iam.policyDelta.bindingDeltas) AS bindingDelta
WHERE
timestamp >= TIMESTAMP_SUB(CURRENT_TIMESTAMP(), INTERVAL 180 DAY)
AND (
(resource.type = "service_account"
AND protopayload_auditlog.methodName LIKE "google.iam.admin.%.SetIAMPolicy")
OR
(resource.type IN ("project", "folder", "organization")
AND protopayload_auditlog.methodName = "SetIamPolicy"
AND bindingDelta.role LIKE "roles/iam.serviceAccount%")
)
AND bindingDelta.action = 'ADD'
-- Principal (grantee) exclusions
AND bindingDelta.member NOT LIKE "%@example.com"
ORDER BY
timestamp DESC
#### Any service accounts or keys created by non-approved identity?
By analyzing Admin Activity audit logs, the following query detects any service
accounts or keys that have been manually created by a user. For example, you
might follow a best practice to only allow service accounts to be created by an
approved service account as part of an automated workflow. Therefore, any service
account creation outside of that workflow is considered non-compliant and possibly malicious.
### Observability Analytics
SELECT
timestamp,
proto_payload.audit_log.authentication_info.principal_email,
proto_payload.audit_log.method_name,
proto_payload.audit_log.resource_name,
JSON_VALUE(proto_payload.audit_log.response.email) as service_account_email
FROM
`[MY_PROJECT_ID].[MY_LOG_BUCKET_REGION].[MY_LOG_BUCKET_NAME]._AllLogs`
WHERE
timestamp >= TIMESTAMP_SUB(CURRENT_TIMESTAMP(), INTERVAL 30 DAY)
AND resource.type="service_account"
AND proto_payload.audit_log.method_name LIKE "%CreateServiceAccount%"
AND proto_payload.audit_log.authentication_info.principal_email NOT LIKE "%.gserviceaccount.com"
### BigQuery
SELECT
timestamp,
protopayload_auditlog.authenticationInfo.principalEmail,
protopayload_auditlog.methodName,
protopayload_auditlog.resourceName,
JSON_VALUE(protopayload_auditlog.responseJson, "$.email") as serviceAccountEmail
FROM
`[MY_PROJECT_ID].[MY_DATASET_ID].cloudaudit_googleapis_com_activity`
WHERE
timestamp >= TIMESTAMP_SUB(CURRENT_TIMESTAMP(), INTERVAL 180 DAY)
AND resource.type="service_account"
AND protopayload_auditlog.methodName LIKE "%CreateServiceAccount%"
AND protopayload_auditlog.authenticationInfo.principalEmail NOT LIKE "%.gserviceaccount.com"
#### Any user added to (or removed from) sensitive IAM policy?
By searching Admin Activity audit logs, the following query detects any user or
group access change for an IAP-secured resource such as a
Compute Engine backend service. The following query searches all IAM
policy updates for IAP resources involving the IAM
role `roles/iap.httpsResourceAccessor`. This role provides permissions to access
the HTTPS resource or the backend service. Any query results might indicate
attempts to bypass the defenses of a backend service that might be exposed to
the internet.
### Observability Analytics
SELECT
timestamp,
proto_payload.audit_log.authentication_info.principal_email,
resource.type,
proto_payload.audit_log.resource_name,
JSON_VALUE(binding, '$.role') as role,
JSON_VALUE_ARRAY(binding, '$.members') as members
FROM
`[MY_PROJECT_ID].[MY_LOG_BUCKET_REGION].[MY_LOG_BUCKET_NAME]._AllLogs`,
UNNEST(JSON_QUERY_ARRAY(proto_payload.audit_log.response, '$.bindings')) AS binding
WHERE
timestamp >= TIMESTAMP_SUB(CURRENT_TIMESTAMP(), INTERVAL 30 DAY)
-- AND log_id = "cloudaudit.googleapis.com/activity"
AND proto_payload.audit_log.service_name = "iap.googleapis.com"
AND proto_payload.audit_log.method_name LIKE "%.IdentityAwareProxyAdminService.SetIamPolicy"
AND JSON_VALUE(binding, '$.role') = "roles/iap.httpsResourceAccessor"
ORDER BY
timestamp DESC
### BigQuery
SELECT
timestamp,
protopayload_auditlog.authenticationInfo.principalEmail,
resource.type,
protopayload_auditlog.resourceName,
JSON_VALUE(binding, '$.role') as role,
JSON_VALUE_ARRAY(binding, '$.members') as members
FROM
`[MY_PROJECT_ID].[MY_DATASET_ID].cloudaudit_googleapis_com_activity`,
UNNEST(JSON_QUERY_ARRAY(protopayload_auditlog.responseJson, '$.bindings')) AS binding
WHERE
timestamp >= TIMESTAMP_SUB(CURRENT_TIMESTAMP(), INTERVAL 400 DAY)
AND protopayload_auditlog.serviceName = "iap.googleapis.com"
AND protopayload_auditlog.methodName LIKE "%.IdentityAwareProxyAdminService.SetIamPolicy"
AND JSON_VALUE(binding, '$.role') = "roles/iap.httpsResourceAccessor"
ORDER BY
timestamp DESC
### Provisioning activity questions
These sample queries perform analysis to detect suspicious or anomalous admin
activity like provisioning and configuring resources.
#### Any changes made to logging settings?
By searching Admin Activity audit logs, the following query detects any change
made to logging settings. Monitoring logging settings helps you detect
accidental or malicious disabling of audit logs and similar defense evasion
techniques.
### Observability Analytics
SELECT
receive_timestamp, timestamp AS eventTimestamp,
proto_payload.audit_log.request_metadata.caller_ip,
proto_payload.audit_log.authentication_info.principal_email,
proto_payload.audit_log.resource_name,
proto_payload.audit_log.method_name
FROM
`[MY_PROJECT_ID].[MY_LOG_BUCKET_REGION].[MY_LOG_BUCKET_NAME]._AllLogs`
WHERE
proto_payload.audit_log.service_name = "logging.googleapis.com"
AND log_id = "cloudaudit.googleapis.com/activity"
### BigQuery
SELECT
receiveTimestamp, timestamp AS eventTimestamp,
protopayload_auditlog.requestMetadata.callerIp,
protopayload_auditlog.authenticationInfo.principalEmail,
protopayload_auditlog.resourceName,
protopayload_auditlog.methodName
FROM `[MY_PROJECT_ID].[MY_DATASET_ID].cloudaudit_googleapis_com_activity`
WHERE
protopayload_auditlog.serviceName = "logging.googleapis.com"
#### Any VPC Flow Logs actively disabled?
By searching Admin Activity audit logs, the following query detects any subnet
whose VPC Flow Logs were actively disabled . Monitoring VPC Flow Logs
settings helps you detect accidental or malicious disabling of VPC Flow Logs
and similar defense evasion techniques.
### Observability Analytics
SELECT
receive_timestamp, timestamp AS eventTimestamp,
proto_payload.audit_log.request_metadata.caller_ip,
proto_payload.audit_log.authentication_info.principal_email,
proto_payload.audit_log.resource_name,
proto_payload.audit_log.method_name
FROM
`[MY_PROJECT_ID].[MY_LOG_BUCKET_REGION].[MY_LOG_BUCKET_NAME]._AllLogs`
WHERE
proto_payload.audit_log.method_name = "v1.compute.subnetworks.patch"
AND (
JSON_VALUE(proto_payload.audit_log.request, "$.logConfig.enable") = "false"
OR JSON_VALUE(proto_payload.audit_log.request, "$.enableFlowLogs") = "false"
)
### BigQuery
SELECT
receiveTimestamp, timestamp AS eventTimestamp,
protopayload_auditlog.requestMetadata.callerIp,
protopayload_auditlog.authenticationInfo.principalEmail,
protopayload_auditlog.resourceName,
protopayload_auditlog.methodName
FROM `[MY_PROJECT_ID].[MY_DATASET_ID].cloudaudit_googleapis_com_activity`
WHERE
protopayload_auditlog.methodName = "v1.compute.subnetworks.patch"
AND JSON_VALUE(protopayload_auditlog.requestJson, "$.logConfig.enable") = "false"
#### Any unusually high number of firewall rules modified in the past week?
By searching Admin Activity audit logs, the following query detects any unusually
high number of firewall rules changes on any given day in the past week. To determine
whether there is an outlier, the query performs statistical analysis over the
daily counts of firewall rules changes. Averages and standard deviations are
computed for each day by looking back at the preceding daily counts with a
lookback window of 90 days. An outlier is considered when the daily count is
more than two standard deviations above the mean. The query, including the
standard deviation factor and the lookback windows, can all be configured to fit
your cloud provisioning activity profile and to minimize false positives.
### Observability Analytics
SELECT
*
FROM (
SELECT
*,
AVG(counter) OVER (
ORDER BY day
ROWS BETWEEN UNBOUNDED PRECEDING AND 1 PRECEDING) AS avg,
STDDEV(counter) OVER (
ORDER BY day
ROWS BETWEEN UNBOUNDED PRECEDING AND 1 PRECEDING) AS stddev,
COUNT(*) OVER (
RANGE BETWEEN UNBOUNDED PRECEDING AND UNBOUNDED FOLLOWING) AS numSamples
FROM (
SELECT
EXTRACT(DATE FROM timestamp) AS day,
ARRAY_AGG(DISTINCT proto_payload.audit_log.method_name IGNORE NULLS) AS actions,
ARRAY_AGG(DISTINCT proto_payload.audit_log.authentication_info.principal_email IGNORE NULLS) AS actors,
COUNT(*) AS counter
FROM `[MY_PROJECT_ID].[MY_LOG_BUCKET_REGION].[MY_LOG_BUCKET_NAME]._AllLogs`
WHERE
timestamp >= TIMESTAMP_SUB(CURRENT_TIMESTAMP(), INTERVAL 90 DAY)
AND proto_payload.audit_log.method_name LIKE "v1.compute.firewalls.%"
AND proto_payload.audit_log.method_name NOT IN ("v1.compute.firewalls.list", "v1.compute.firewalls.get")
GROUP BY
day
)
)
WHERE
counter > avg + 2 * stddev
AND day >= DATE_SUB(CURRENT_DATE(), INTERVAL 7 DAY)
ORDER BY
counter DESC
### BigQuery
SELECT
*,
AVG(counter) OVER (
ORDER BY day
ROWS BETWEEN UNBOUNDED PRECEDING AND 1 PRECEDING) AS avg,
STDDEV(counter) OVER (
ORDER BY day
ROWS BETWEEN UNBOUNDED PRECEDING AND 1 PRECEDING) AS stddev,
COUNT(*) OVER (
RANGE BETWEEN UNBOUNDED PRECEDING AND UNBOUNDED FOLLOWING) AS numSamples
FROM (
SELECT
EXTRACT(DATE FROM timestamp) AS day,
ARRAY_AGG(DISTINCT protopayload_auditlog.methodName IGNORE NULLS) AS actions,
ARRAY_AGG(DISTINCT protopayload_auditlog.authenticationInfo.principalEmail IGNORE NULLS) AS actors,
COUNT(*) AS counter
FROM `[MY_PROJECT_ID].[MY_DATASET_ID].cloudaudit_googleapis_com_activity`
WHERE
timestamp >= TIMESTAMP_SUB(CURRENT_TIMESTAMP(), INTERVAL 90 DAY)
AND protopayload_auditlog.methodName LIKE "v1.compute.firewalls.%"
AND protopayload_auditlog.methodName NOT IN ("v1.compute.firewalls.list", "v1.compute.firewalls.get")
GROUP BY
day
)
WHERE TRUE
QUALIFY
counter > avg + 2 * stddev
AND day >= DATE_SUB(CURRENT_DATE(), INTERVAL 7 DAY)
ORDER BY
counter DESC
#### Any VMs deleted in the past week?
By searching Admin Activity audit logs, the following query lists any
Compute Engine instances deleted in the past week. This query can help you
audit resource deletions and detect potential malicious activity.
### Observability Analytics
SELECT
timestamp,
JSON_VALUE(resource.labels.instance_id) AS instance_id,
proto_payload.audit_log.authentication_info.principal_email,
proto_payload.audit_log.resource_name,
proto_payload.audit_log.method_name
FROM
`[MY_PROJECT_ID].[MY_LOG_BUCKET_REGION].[MY_LOG_BUCKET_NAME]._AllLogs`
WHERE
resource.type = "gce_instance"
AND proto_payload.audit_log.method_name = "v1.compute.instances.delete"
AND operation.first IS TRUE
AND timestamp >= TIMESTAMP_SUB(CURRENT_TIMESTAMP(), INTERVAL 7 DAY)
ORDER BY
timestamp desc,
instance_id
LIMIT
1000
### BigQuery
SELECT
timestamp,
resource.labels.instance_id,
protopayload_auditlog.authenticationInfo.principalEmail,
protopayload_auditlog.resourceName,
protopayload_auditlog.methodName
FROM `[MY_PROJECT_ID].[MY_DATASET_ID].cloudaudit_googleapis_com_activity`
WHERE
resource.type = "gce_instance"
AND protopayload_auditlog.methodName = "v1.compute.instances.delete"
AND operation.first IS TRUE
AND timestamp >= TIMESTAMP_SUB(CURRENT_TIMESTAMP(), INTERVAL 7 DAY)
ORDER BY
timestamp desc,
resource.labels.instance_id
LIMIT
1000
### Workload usage questions
These sample queries perform analysis to understand who and what is consuming
your cloud workloads and APIs, and help you detect potential malicious behavior
internally or externally.
#### Any unusually high API usage by any user identity in the past week?
By analyzing all Cloud Audit Logs, the following query detects unusually high API
usage by any user identity on any given day in the past week. Such unusually high
usage might be an indicator of potential API abuse, insider threat, or leaked
credentials. To determine whether there is an outlier, this query performs
statistical analysis over the daily count of actions per principal. Averages and
standard deviations are computed for each day and for each principal by looking
back at the preceding daily counts with a lookback window of 60 days. An outlier
is considered when the daily count for a user is more than three standard deviations
above their mean. The query, including the standard deviation factor and the
lookback windows, are all configurable to fit your cloud provisioning activity
profile and to minimize false positives.
### Observability Analytics
SELECT
*
FROM (
SELECT
*,
AVG(counter) OVER (
PARTITION BY principal_email
ORDER BY day
ROWS BETWEEN UNBOUNDED PRECEDING AND 1 PRECEDING) AS avg,
STDDEV(counter) OVER (
PARTITION BY principal_email
ORDER BY day
ROWS BETWEEN UNBOUNDED PRECEDING AND 1 PRECEDING) AS stddev,
COUNT(*) OVER (
PARTITION BY principal_email
RANGE BETWEEN UNBOUNDED PRECEDING AND UNBOUNDED FOLLOWING) AS numSamples
FROM (
SELECT
proto_payload.audit_log.authentication_info.principal_email,
EXTRACT(DATE FROM timestamp) AS day,
ARRAY_AGG(DISTINCT proto_payload.audit_log.method_name IGNORE NULLS) AS actions,
COUNT(*) AS counter
FROM `[MY_PROJECT_ID].[MY_LOG_BUCKET_REGION].[MY_LOG_BUCKET_NAME]._AllLogs`
WHERE
timestamp >= TIMESTAMP_SUB(CURRENT_TIMESTAMP(), INTERVAL 60 DAY)
AND proto_payload.audit_log.authentication_info.principal_email IS NOT NULL
AND proto_payload.audit_log.method_name NOT LIKE "storage.%.get"
AND proto_payload.audit_log.method_name NOT LIKE "v1.compute.%.list"
AND proto_payload.audit_log.method_name NOT LIKE "beta.compute.%.list"
GROUP BY
proto_payload.audit_log.authentication_info.principal_email,
day
)
)
WHERE
counter > avg + 3 * stddev
AND day >= DATE_SUB(CURRENT_DATE(), INTERVAL 7 DAY)
ORDER BY
counter DESC
### BigQuery
SELECT
*,
AVG(counter) OVER (
PARTITION BY principalEmail
ORDER BY day
ROWS BETWEEN UNBOUNDED PRECEDING AND 1 PRECEDING) AS avg,
STDDEV(counter) OVER (
PARTITION BY principalEmail
ORDER BY day
ROWS BETWEEN UNBOUNDED PRECEDING AND 1 PRECEDING) AS stddev,
COUNT(*) OVER (
PARTITION BY principalEmail
RANGE BETWEEN UNBOUNDED PRECEDING AND UNBOUNDED FOLLOWING) AS numSamples
FROM (
SELECT
protopayload_auditlog.authenticationInfo.principalEmail,
EXTRACT(DATE FROM timestamp) AS day,
ARRAY_AGG(DISTINCT protopayload_auditlog.methodName IGNORE NULLS) AS actions,
COUNT(*) AS counter
FROM `[MY_PROJECT_ID].[MY_DATASET_ID].cloudaudit_googleapis_com_*`
WHERE
timestamp >= TIMESTAMP_SUB(CURRENT_TIMESTAMP(), INTERVAL 60 DAY)
AND protopayload_auditlog.authenticationInfo.principalEmail IS NOT NULL
AND protopayload_auditlog.methodName NOT LIKE "storage.%.get"
AND protopayload_auditlog.methodName NOT LIKE "v1.compute.%.list"
AND protopayload_auditlog.methodName NOT LIKE "beta.compute.%.list"
GROUP BY
protopayload_auditlog.authenticationInfo.principalEmail,
day
)
WHERE TRUE
QUALIFY
counter > avg + 3 * stddev
AND day >= DATE_SUB(CURRENT_DATE(), INTERVAL 7 DAY)
ORDER BY
counter DESC
#### What is the autoscaling usage per day in the past month?
By analyzing Admin Activity audit logs, the following query reports the
autoscaling usage by day for the last month. This query can be used
to identify patterns or anomalies that warrant further security investigation.
### Observability Analytics
SELECT
TIMESTAMP_TRUNC(timestamp, DAY) AS day,
proto_payload.audit_log.method_name,
COUNT(*) AS counter
FROM
`[MY_PROJECT_ID].[MY_LOG_BUCKET_REGION].[MY_LOG_BUCKET_NAME]._AllLogs`
WHERE
resource.type = "gce_instance_group_manager"
AND log_id = "cloudaudit.googleapis.com/activity"
AND timestamp >= TIMESTAMP_SUB(CURRENT_TIMESTAMP(), INTERVAL 30 DAY)
GROUP BY
1, 2
ORDER BY
1, 2
### BigQuery
SELECT
TIMESTAMP_TRUNC(timestamp, DAY) AS day,
protopayload_auditlog.methodName AS methodName,
COUNT(*) AS counter
FROM `[MY_PROJECT_ID].[MY_DATASET_ID].cloudaudit_googleapis_com_activity`
WHERE
resource.type = "gce_instance_group_manager"
AND timestamp >= TIMESTAMP_SUB(CURRENT_TIMESTAMP(), INTERVAL 30 DAY)
GROUP BY
1, 2
ORDER BY
1, 2
### Data access questions
These sample queries perform analysis to understand who is accessing or
modifying data in Google Cloud.
#### Which users most frequently accessed data in the past week?
The following query uses the Data Access audit logs to find the user
identities that most frequently accessed BigQuery tables data
over the past week.
### Observability Analytics
SELECT
proto_payload.audit_log.authentication_info.principal_email,
COUNT(*) AS COUNTER
FROM
`[MY_PROJECT_ID].[MY_LOG_BUCKET_REGION].[MY_LOG_BUCKET_NAME]._AllLogs`
WHERE
(proto_payload.audit_log.method_name = "google.cloud.bigquery.v2.JobService.InsertJob" OR
proto_payload.audit_log.method_name = "google.cloud.bigquery.v2.JobService.Query")
AND timestamp >= TIMESTAMP_SUB(CURRENT_TIMESTAMP(), INTERVAL 7 DAY)
AND log_id = "cloudaudit.googleapis.com/data_access"
GROUP BY
1
ORDER BY
2 desc, 1
LIMIT
100
### BigQuery
SELECT
protopayload_auditlog.authenticationInfo.principalEmail,
COUNT(*) AS COUNTER
FROM `[MY_PROJECT_ID].[MY_DATASET_ID].cloudaudit_googleapis_com_data_access`
WHERE
(protopayload_auditlog.methodName = "google.cloud.bigquery.v2.JobService.InsertJob" OR
protopayload_auditlog.methodName = "google.cloud.bigquery.v2.JobService.Query")
AND timestamp >= TIMESTAMP_SUB(CURRENT_TIMESTAMP(), INTERVAL 7 DAY)
GROUP BY
1
ORDER BY
2 desc, 1
LIMIT
100
#### Which users accessed the data in the "accounts" table last month?
The following query uses the Data Access audit logs to find the user
identities that most frequently queried a given `accounts` table over the past month.
Besides the `MY_DATASET_ID` and
`MY_PROJECT_ID` placeholders for your BigQuery
export destination, the following query uses the `DATASET_ID`
and `PROJECT_ID` placeholders. You need to replace to the
`DATASET_ID` and `PROJECT_ID`
placeholders in order to specify the target table whose access is being analyzed,
such as the `accounts` table in this example.
### Observability Analytics
SELECT
proto_payload.audit_log.authentication_info.principal_email,
COUNT(*) AS COUNTER
FROM
`[MY_PROJECT_ID].[MY_LOG_BUCKET_REGION].[MY_LOG_BUCKET_NAME]._AllLogs`,
UNNEST(proto_payload.audit_log.authorization_info) authorization_info
WHERE
(proto_payload.audit_log.method_name = "google.cloud.bigquery.v2.JobService.InsertJob" OR
proto_payload.audit_log.method_name = "google.cloud.bigquery.v2.JobService.Query")
AND authorization_info.permission = "bigquery.tables.getData"
AND authorization_info.resource = "projects/[PROJECT_ID]/datasets/[DATASET_ID]/tables/accounts"
AND timestamp >= TIMESTAMP_SUB(CURRENT_TIMESTAMP(), INTERVAL 30 DAY)
GROUP BY
1
ORDER BY
2 desc, 1
LIMIT
100
### BigQuery
SELECT
protopayload_auditlog.authenticationInfo.principalEmail,
COUNT(*) AS COUNTER
FROM `[MY_PROJECT_ID].[MY_DATASET_ID].cloudaudit_googleapis_com_data_access`,
UNNEST(protopayload_auditlog.authorizationInfo) authorizationInfo
WHERE
(protopayload_auditlog.methodName = "google.cloud.bigquery.v2.JobService.InsertJob" OR
protopayload_auditlog.methodName = "google.cloud.bigquery.v2.JobService.Query")
AND authorizationInfo.permission = "bigquery.tables.getData"
AND authorizationInfo.resource = "projects/[PROJECT_ID]/datasets/[DATASET_ID]/tables/accounts"
AND timestamp >= TIMESTAMP_SUB(CURRENT_TIMESTAMP(), INTERVAL 30 DAY)
GROUP BY
1
ORDER BY
2 desc, 1
LIMIT
100
#### What tables are most frequently accessed and by whom?
The following query uses the Data Access audit logs to find the
BigQuery tables with most frequently read and modified data over the
past month. It displays the associated user identity along with breakdown of
total number of times data was read versus modified.
### Observability Analytics
SELECT
proto_payload.audit_log.resource_name,
proto_payload.audit_log.authentication_info.principal_email,
COUNTIF(JSON_VALUE(proto_payload.audit_log.metadata, "$.tableDataRead") IS NOT NULL) AS dataReadEvents,
COUNTIF(JSON_VALUE(proto_payload.audit_log.metadata, "$.tableDataChange") IS NOT NULL) AS dataChangeEvents,
COUNT(*) AS totalEvents
FROM
`[MY_PROJECT_ID].[MY_LOG_BUCKET_REGION].[MY_LOG_BUCKET_NAME]._AllLogs`
WHERE
STARTS_WITH(resource.type, 'bigquery') IS TRUE
AND (JSON_VALUE(proto_payload.audit_log.metadata, "$.tableDataRead") IS NOT NULL
OR JSON_VALUE(proto_payload.audit_log.metadata, "$.tableDataChange") IS NOT NULL)
AND timestamp >= TIMESTAMP_SUB(CURRENT_TIMESTAMP(), INTERVAL 30 DAY)
GROUP BY
1, 2
ORDER BY
5 DESC, 1, 2
LIMIT 1000
### BigQuery
SELECT
protopayload_auditlog.resourceName,
protopayload_auditlog.authenticationInfo.principalEmail,
COUNTIF(JSON_EXTRACT(protopayload_auditlog.metadataJson, "$.tableDataRead") IS NOT NULL) AS dataReadEvents,
COUNTIF(JSON_EXTRACT(protopayload_auditlog.metadataJson, "$.tableDataChange") IS NOT NULL) AS dataChangeEvents,
COUNT(*) AS totalEvents
FROM `[MY_PROJECT_ID].[MY_DATASET_ID].cloudaudit_googleapis_com_data_access`
WHERE
STARTS_WITH(resource.type, 'bigquery') IS TRUE
AND (JSON_EXTRACT(protopayload_auditlog.metadataJson, "$.tableDataRead") IS NOT NULL
OR JSON_EXTRACT(protopayload_auditlog.metadataJson, "$.tableDataChange") IS NOT NULL)
AND timestamp >= TIMESTAMP_SUB(CURRENT_TIMESTAMP(), INTERVAL 30 DAY)
GROUP BY
1, 2
ORDER BY
5 DESC, 1, 2
LIMIT 1000
#### What are the top 10 queries against BigQuery in the past week?
The following query uses the Data Access audit logs to find the
most common queries over the past week. It also lists the corresponding users
and the referenced tables.
### Observability Analytics
SELECT
COALESCE(
JSON_VALUE(proto_payload.audit_log.metadata, "$.jobChange.job.jobConfig.queryConfig.query"),
JSON_VALUE(proto_payload.audit_log.metadata, "$.jobInsertion.job.jobConfig.queryConfig.query")) as query,
STRING_AGG(DISTINCT proto_payload.audit_log.authentication_info.principal_email, ',') as users,
ANY_VALUE(COALESCE(
JSON_EXTRACT_ARRAY(proto_payload.audit_log.metadata, "$.jobChange.job.jobStats.queryStats.referencedTables"),
JSON_EXTRACT_ARRAY(proto_payload.audit_log.metadata, "$.jobInsertion.job.jobStats.queryStats.referencedTables"))) as tables,
COUNT(*) AS counter
FROM
`[MY_PROJECT_ID].[MY_LOG_BUCKET_REGION].[MY_LOG_BUCKET_NAME]._AllLogs`
WHERE
(resource.type = 'bigquery_project' OR resource.type = 'bigquery_dataset')
AND operation.last IS TRUE
AND (JSON_VALUE(proto_payload.audit_log.metadata, "$.jobChange") IS NOT NULL
OR JSON_VALUE(proto_payload.audit_log.metadata, "$.jobInsertion") IS NOT NULL)
AND timestamp >= TIMESTAMP_SUB(CURRENT_TIMESTAMP(), INTERVAL 7 DAY)
GROUP BY
query
ORDER BY
counter DESC
LIMIT 10
### BigQuery
SELECT
COALESCE(
JSON_EXTRACT_SCALAR(protopayload_auditlog.metadataJson, "$.jobChange.job.jobConfig.queryConfig.query"),
JSON_EXTRACT_SCALAR(protopayload_auditlog.metadataJson, "$.jobInsertion.job.jobConfig.queryConfig.query")) as query,
STRING_AGG(DISTINCT protopayload_auditlog.authenticationInfo.principalEmail, ',') as users,
ANY_VALUE(COALESCE(
JSON_EXTRACT_ARRAY(protopayload_auditlog.metadataJson, "$.jobChange.job.jobStats.queryStats.referencedTables"),
JSON_EXTRACT_ARRAY(protopayload_auditlog.metadataJson, "$.jobInsertion.job.jobStats.queryStats.referencedTables"))) as tables,
COUNT(*) AS counter
FROM `[MY_PROJECT_ID].[MY_DATASET_ID].cloudaudit_googleapis_com_data_access`
WHERE
(resource.type = 'bigquery_project' OR resource.type = 'bigquery_dataset')
AND operation.last IS TRUE
AND (JSON_EXTRACT(protopayload_auditlog.metadataJson, "$.jobChange") IS NOT NULL
OR JSON_EXTRACT(protopayload_auditlog.metadataJson, "$.jobInsertion") IS NOT NULL)
AND timestamp >= TIMESTAMP_SUB(CURRENT_TIMESTAMP(), INTERVAL 7 DAY)
GROUP BY
query
ORDER BY
counter DESC
LIMIT 10
#### What are the most common actions recorded in the data access log over the past month?
The following query uses all logs from Cloud Audit Logs to find the 100 most
frequent actions recorded over the past month.
### Observability Analytics
SELECT
proto_payload.audit_log.method_name,
proto_payload.audit_log.service_name,
resource.type,
COUNT(*) AS counter
FROM `[MY_PROJECT_ID].[MY_LOG_BUCKET_REGION].[MY_LOG_BUCKET_NAME]._AllLogs`
WHERE
timestamp >= TIMESTAMP_SUB(CURRENT_TIMESTAMP(), INTERVAL 30 DAY)
AND log_id="cloudaudit.googleapis.com/data_access"
GROUP BY
proto_payload.audit_log.method_name,
proto_payload.audit_log.service_name,
resource.type
ORDER BY
counter DESC
LIMIT 100
### BigQuery
SELECT
protopayload_auditlog.methodName,
protopayload_auditlog.serviceName,
resource.type,
COUNT(*) AS counter
FROM `[MY_PROJECT_ID].[MY_DATASET_ID].cloudaudit_googleapis_com_data_access`
WHERE
timestamp >= TIMESTAMP_SUB(CURRENT_TIMESTAMP(), INTERVAL 30 DAY)
GROUP BY
protopayload_auditlog.methodName,
protopayload_auditlog.serviceName,
resource.type
ORDER BY
counter DESC
LIMIT 100
### Network security questions
These sample queries perform analysis over your network activity in Google Cloud.
#### Any connections from a new IP address to a specific subnetwork?
The following query detects connections from any new source IP address to a
given subnet by analyzing VPC Flow Logs. In this example, a source IP
address is considered new if it was seen for the first time in the last 24 hours
over a lookback window of 60 days. You might want to use and tune this query on
a subnet that is in-scope for a particular compliance requirement like PCI.
### Observability Analytics
SELECT
JSON_VALUE(json_payload.connection.src_ip) as src_ip,
-- TIMESTAMP supports up to 6 digits of fractional precision, so drop any more digits to avoid parse errors
MIN(TIMESTAMP(REGEXP_REPLACE(JSON_VALUE(json_payload.start_time), r'\.(\d{0,6})\d+(Z)?$', '.\\1\\2'))) AS firstInstance,
MAX(TIMESTAMP(REGEXP_REPLACE(JSON_VALUE(json_payload.start_time), r'\.(\d{0,6})\d+(Z)?$', '.\\1\\2'))) AS lastInstance,
ARRAY_AGG(DISTINCT JSON_VALUE(resource.labels.subnetwork_name)) as subnetNames,
ARRAY_AGG(DISTINCT JSON_VALUE(json_payload.dest_instance.vm_name)) as vmNames,
COUNT(*) numSamples
FROM `[MY_PROJECT_ID].[MY_LOG_BUCKET_REGION].[MY_LOG_BUCKET_NAME]._AllLogs`
WHERE
timestamp >= TIMESTAMP_SUB(CURRENT_TIMESTAMP(), INTERVAL 60 DAY)
AND JSON_VALUE(json_payload.reporter) = 'DEST'
AND JSON_VALUE(resource.labels.subnetwork_name) IN ('prod-customer-data')
GROUP BY
src_ip
HAVING firstInstance >= TIMESTAMP_SUB(CURRENT_TIMESTAMP(), INTERVAL 1 DAY)
ORDER BY
lastInstance DESC,
numSamples DESC
### BigQuery
SELECT
jsonPayload.connection.src_ip as src_ip,
-- TIMESTAMP supports up to 6 digits of fractional precision, so drop any more digits to avoid parse errors
MIN(TIMESTAMP(REGEXP_REPLACE(jsonPayload.start_time, r'\.(\d{0,6})\d+(Z)?$', '.\\1\\2'))) AS firstInstance,
MAX(TIMESTAMP(REGEXP_REPLACE(jsonPayload.start_time, r'\.(\d{0,6})\d+(Z)?$', '.\\1\\2'))) AS lastInstance,
ARRAY_AGG(DISTINCT resource.labels.subnetwork_name) as subnetNames,
ARRAY_AGG(DISTINCT jsonPayload.dest_instance.vm_name) as vmNames,
COUNT(*) numSamples
FROM `[MY_PROJECT_ID].[MY_DATASET_ID].compute_googleapis_com_vpc_flows`
WHERE
timestamp >= TIMESTAMP_SUB(CURRENT_TIMESTAMP(), INTERVAL 60 DAY)
AND jsonPayload.reporter = 'DEST'
AND resource.labels.subnetwork_name IN ('prod-customer-data')
GROUP BY
src_ip
HAVING firstInstance >= TIMESTAMP_SUB(CURRENT_TIMESTAMP(), INTERVAL 1 DAY)
ORDER BY
lastInstance DESC,
numSamples DESC
#### Any connections blocked by Google Cloud Armor?
The following query helps detect potential exploit attempts by analyzing
external Application Load Balancer logs to find any connection blocked by the
security policy configured in Google Cloud Armor. This query assumes that you have a
Google Cloud Armor security policy configured on your external Application Load Balancer.
This query also assumes that you have enabled external Application Load Balancer
logging as described in the instructions that are provided by the **Enable**
link in the [log scoping tool](https://docs.cloud.google.com/architecture/security-log-analytics#log_scoping_tool).
### Observability Analytics
SELECT
timestamp,
http_request.remote_ip,
http_request.request_method,
http_request.status,
JSON_VALUE(json_payload.enforcedSecurityPolicy.name) AS security_policy_name,
JSON_VALUE(resource.labels.backend_service_name) AS backend_service_name,
http_request.request_url,
FROM `[MY_PROJECT_ID].[MY_LOG_BUCKET_REGION].[MY_LOG_BUCKET_NAME]._AllLogs`
WHERE
timestamp >= TIMESTAMP_SUB(CURRENT_TIMESTAMP(), INTERVAL 30 DAY)
AND resource.type="http_load_balancer"
AND JSON_VALUE(json_payload.statusDetails) = "denied_by_security_policy"
ORDER BY
timestamp DESC
### BigQuery
SELECT
timestamp,
httpRequest.remoteIp,
httpRequest.requestMethod,
httpRequest.status,
jsonpayload_type_loadbalancerlogentry.enforcedsecuritypolicy.name,
resource.labels.backend_service_name,
httpRequest.requestUrl,
FROM `[MY_PROJECT_ID].[MY_DATASET_ID].requests`
WHERE
timestamp >= TIMESTAMP_SUB(CURRENT_TIMESTAMP(), INTERVAL 30 DAY)
AND resource.type="http_load_balancer"
AND jsonpayload_type_loadbalancerlogentry.statusdetails = "denied_by_security_policy"
ORDER BY
timestamp DESC
#### Any high-severity virus or malware detected by Cloud IDS?
The following query shows any high-severity virus or malware detected by
Cloud IDS by searching Cloud IDS Threat Logs. This query
assumes that you have a [Cloud IDS endpoint configured](https://docs.cloud.google.com/intrusion-detection-system/docs/configuring-ids).
### Observability Analytics
SELECT
JSON_VALUE(json_payload.alert_time) AS alert_time,
JSON_VALUE(json_payload.name) AS name,
JSON_VALUE(json_payload.details) AS details,
JSON_VALUE(json_payload.application) AS application,
JSON_VALUE(json_payload.uri_or_filename) AS uri_or_filename,
JSON_VALUE(json_payload.ip_protocol) AS ip_protocol,
FROM `[MY_PROJECT_ID].[MY_LOG_BUCKET_REGION].[MY_LOG_BUCKET_NAME]._AllLogs`
WHERE
timestamp >= TIMESTAMP_SUB(CURRENT_TIMESTAMP(), INTERVAL 30 DAY)
AND resource.type="ids.googleapis.com/Endpoint"
AND JSON_VALUE(json_payload.alert_severity) IN ("HIGH", "CRITICAL")
AND JSON_VALUE(json_payload.type) = "virus"
ORDER BY
timestamp DESC
### BigQuery
SELECT
jsonPayload.alert_time,
jsonPayload.name,
jsonPayload.details,
jsonPayload.application,
jsonPayload.uri_or_filename,
jsonPayload.ip_protocol
FROM `[MY_PROJECT_ID].[MY_DATASET_ID].ids_googleapis_com_threat`
WHERE
timestamp >= TIMESTAMP_SUB(CURRENT_TIMESTAMP(), INTERVAL 30 DAY)
AND resource.type="ids.googleapis.com/Endpoint"
AND jsonPayload.alert_severity IN ("HIGH", "CRITICAL")
AND jsonPayload.type = "virus"
ORDER BY
timestamp DESC
#### What are the top Cloud DNS queried domains from your VPC network?
The following query lists the top 10 Cloud DNS queried domains from your VPC
network(s) over the last 60 days. This query assumes that you have enabled Cloud DNS
logging for your VPC network(s) as described in the instructions
that are provided by the **Enable** link in the [log scoping tool](https://docs.cloud.google.com/architecture/security-log-analytics#log_scoping_tool).
### Observability Analytics
SELECT
JSON_VALUE(json_payload.queryName) AS query_name,
COUNT(*) AS total_queries
FROM
`[MY_PROJECT_ID].[MY_LOG_BUCKET_REGION].[MY_LOG_BUCKET_NAME]._AllLogs`
WHERE
timestamp >= TIMESTAMP_SUB(CURRENT_TIMESTAMP(), INTERVAL 60 DAY)
AND log_id="dns.googleapis.com/dns_queries"
GROUP BY
query_name
ORDER BY
total_queries DESC
LIMIT
10
### BigQuery
SELECT
jsonPayload.queryname AS query_name,
COUNT(*) AS total_queries
FROM
`[MY_PROJECT_ID].[MY_DATASET_ID].dns_googleapis_com_dns_queries`
WHERE
timestamp >= TIMESTAMP_SUB(CURRENT_TIMESTAMP(), INTERVAL 60 DAY)
GROUP BY
query_name
ORDER BY
total_queries DESC
LIMIT
10
## What's next
- Look at how to [stream logs from Google Cloud to Splunk](https://docs.cloud.google.com/architecture/stream-logs-from-google-cloud-to-splunk).
- Learn how to [Ingest Google Cloud logs to Google Security Operations](https://cloud.google.com/security/chronicle).
-
Explore reference architectures, diagrams, and best practices about Google Cloud.
Take a look at our
[Cloud Architecture Center](https://docs.cloud.google.com/architecture).