This deployment document describes how to deploy a
[Dataflow](https://docs.cloud.google.com/dataflow)
pipeline to process image files at scale with
[Cloud Vision API](https://docs.cloud.google.com/vision/docs).
This pipeline stores the results of the processed files in BigQuery.
You can use the files for analytical purposes or to train
[BigQuery ML models](https://docs.cloud.google.com/bigquery/docs/bqml-introduction).
The Dataflow pipeline you create in this deployment can process
millions of images per day. The only limit is your
[Vision API quota](https://docs.cloud.google.com/vision/quotas).
You can increase your Vision API quota based on your scale
requirements.
These instructions are intended for data engineers and data scientists. This
document assumes you have basic knowledge of building Dataflow
pipelines using
[Apache Beam's Java SDK](https://beam.apache.org/documentation/sdks/java/),
GoogleSQL for BigQuery, and basic shell scripting.
It also assumes that you are familiar with Vision API.
## Architecture
The following diagram illustrates the system flow for building an ML vision
analytics solution.
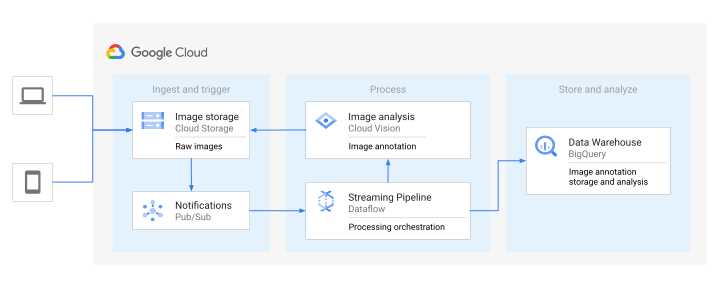
In the preceding diagram, information flows through the architecture as follows:
1. A client uploads image files to a Cloud Storage bucket.
2. Cloud Storage sends a message about the data upload to Pub/Sub.
3. Pub/Sub notifies Dataflow about the upload.
4. The Dataflow pipeline sends the images to Vision API.
5. Vision API processes the images and then returns the annotations.
6. The pipeline sends the annotated files to BigQuery for you to analyze.
## Objectives
- Create an Apache Beam pipeline for image analysis of the images loaded in Cloud Storage.
- Use the [Dataflow Portable Runner](https://docs.cloud.google.com/dataflow/docs/portable-runner) to run the Apache Beam pipeline in a streaming mode to analyze the images as soon as they're uploaded.
- Use Vision API to analyze images for a set of feature types.
- Analyze annotations with BigQuery.
## Costs
In this document, you use the following billable components of Google Cloud:
- [BigQuery](https://cloud.google.com/bigquery/pricing)
- [Cloud Storage](https://docs.cloud.google.com/storage/pricing)
- [Dataflow](https://docs.cloud.google.com/dataflow/pricing)
- [Vision API](https://docs.cloud.google.com/vision/pricing)
- [Pub/Sub](https://docs.cloud.google.com/pubsub/pricing)
To generate a cost estimate based on your projected usage,
use the [pricing calculator](https://docs.cloud.google.com/products/calculator).
New Google Cloud users might be eligible for a [free trial](https://docs.cloud.google.com/free).
When you finish building the example application, you can avoid continued
billing by deleting the resources you created. For more information, see
[Clean up](https://docs.cloud.google.com/architecture/building-a-vision-analytics-solution/deployment#clean_up).
## Before you begin
1. In the Google Cloud console, activate Cloud Shell.
[Activate Cloud Shell](https://console.cloud.google.com/?cloudshell=true)
At the bottom of the Google Cloud console, a
[Cloud Shell](https://docs.cloud.google.com/shell/docs/how-cloud-shell-works)
session starts and displays a command-line prompt. Cloud Shell is a shell environment
with the Google Cloud CLI
already installed and with values already set for
your current project. It can take a few seconds for the session to initialize.
2. Clone the GitHub repository that contains the source code of the Dataflow pipeline:
```
git clone
https://github.com/GoogleCloudPlatform/dataflow-vision-analytics.git
```
3. Go to the root folder of the repository:
```
cd dataflow-vision-analytics
```
4. Follow the instructions in the [Getting started](https://github.com/GoogleCloudPlatform/dataflow-vision-analytics?tab=readme-ov-file#getting-started) section of the *dataflow-vision-analytics* repository in GitHub to accomplish the following tasks:
- Enable several APIs.
- Create a Cloud Storage bucket.
- Create a Pub/Sub topic and subscription.
- Create a BigQuery dataset.
- Set up several environment variables for this deployment.
## Running the Dataflow pipeline for all implemented Vision API features
The Dataflow pipeline requests and processes a specific set of
Vision API features and attributes within the annotated files.
The parameters listed in the following table are specific to the
Dataflow pipeline in this deployment. For the complete list of
standard Dataflow execution parameters, see
[Set Dataflow pipeline options](https://docs.cloud.google.com/dataflow/docs/guides/setting-pipeline-options).
| **Parameter name** | **Description** |
|---|---|
| ` batchSize ` | The number of images to include in a request to Vision API. The default is 1. You can increase this value to a [maximum of 16](https://docs.cloud.google.com/vision/quotas#limits). |
| ` datasetName ` | The name of the output BigQuery dataset. |
| ` features ` | A list of image-processing [features](https://docs.cloud.google.com/vision/docs/features-list). The pipeline supports the label, landmark, logo, face, crop hint, and image properties features. |
| ` keyRange ` | The parameter that defines the max number of parallel calls to Vision API. The default is 1. |
| ` labelAnnottationTable, landmarkAnnotationTable, logoAnnotationTable, faceAnnotationTable, imagePropertiesTable, cropHintAnnotationTable, errorLogTable ` | String parameters with table names for various annotations. The default values are provided for each table---for example, `label_annotation`. |
| ` maxBatchCompletionDurationInSecs ` | The length of time to wait before processing images when there is an incomplete batch of images. The default is 30 seconds. |
| ` subscriberId ` | The ID of the Pub/Sub subscription that receives input Cloud Storage notifications. |
| ` visionApiProjectId ` | The project ID to use for Vision API. |
> [!NOTE]
> **Note:** The code samples in step 1 and step 5 don't specify a dedicated service account to run the deployment pipeline. The pipeline uses the default Compute Engine service account for the project that launches it.
1. In Cloud Shell, run the following command to process images
for all feature types supported by the Dataflow pipeline:
./gradlew run --args=" \
--jobName=test-vision-analytics \
--streaming \
--runner=DataflowRunner \
--enableStreamingEngine \
--diskSizeGb=30 \
--project=${PROJECT} \
--datasetName=${BIGQUERY_DATASET} \
--subscriberId=projects/${PROJECT}/subscriptions/${GCS_NOTIFICATION_SUBSCRIPTION} \
--visionApiProjectId=${PROJECT} \
--features=IMAGE_PROPERTIES,LABEL_DETECTION,LANDMARK_DETECTION,LOGO_DETECTION,CROP_HINTS,FACE_DETECTION"
The dedicated service account needs to have read access to the bucket
containing the images. In other words, that account must have the
`roles/storage.objectViewer` role granted on that bucket.
For more information about using a dedicated service account, see
[Dataflow security and permissions](https://docs.cloud.google.com/dataflow/docs/concepts/security-and-permissions#worker-service-account).
2. Open the displayed URL in a new browser tab, or go to the
[Dataflow Jobs](https://console.cloud.google.com/dataflow/jobs)
page and select the *test-vision-analytics* pipeline.
After a few seconds, the graph for the Dataflow job appears:
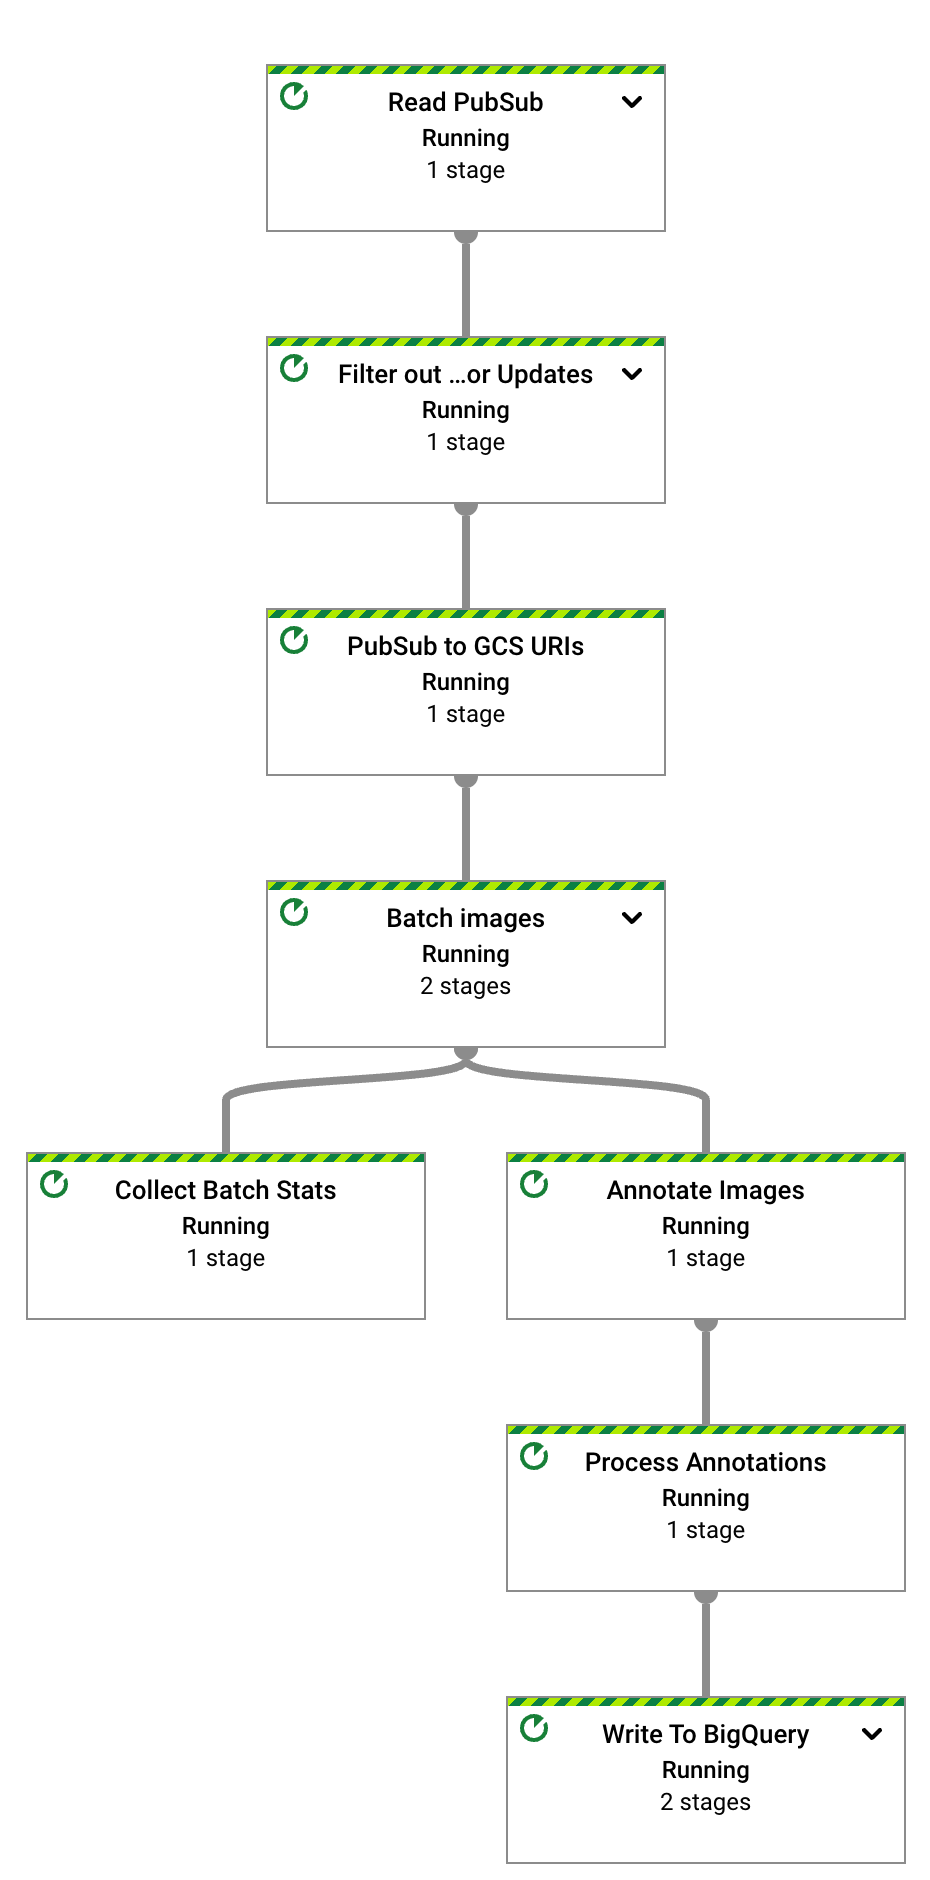
The Dataflow pipeline is now running and waiting to receive
input notifications from the Pub/Sub subscription.
3. Trigger Dataflow image processing by uploading the six sample
files into the input bucket:
gcloud storage cp data-sample/* gs://${IMAGE_BUCKET}
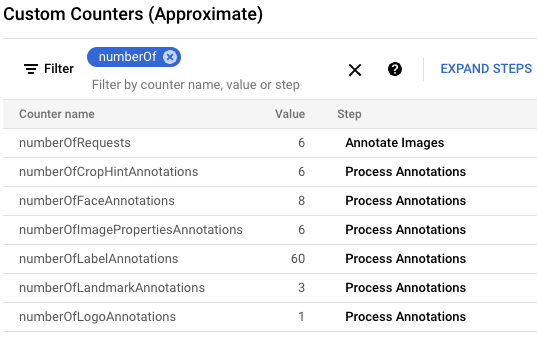
4. In the Google Cloud console, locate the Custom Counters panel and use
it to review the custom counters in Dataflow and to verify
that Dataflow has processed all six images. You can use the
filter functionality of the panel to navigate to the correct metrics. To
only display the counters start with the `numberOf` prefix, type `numberOf`
in the filter.
5. In Cloud Shell, validate that the tables were automatically
created:
bq query --nouse_legacy_sql "SELECT table_name FROM ${BIGQUERY_DATASET}.INFORMATION_SCHEMA.TABLES ORDER BY table_name"
The output is as follows:
```
+---+
| table_name |
+---+
| crop_hint_annotation |
| face_annotation |
| image_properties |
| label_annotation |
| landmark_annotation |
| logo_annotation |
+---+
```
6. View the schema for the `landmark_annotation` table. The
`LANDMARK_DETECTION` feature captures
[the attributes returned from the API call](https://docs.cloud.google.com/vision/docs/reference/rest/v1/AnnotateImageResponse#EntityAnnotation).
bq show --schema --format=prettyjson ${BIGQUERY_DATASET}.landmark_annotation
The output is as follows:
```
[
{
"name":"gcs_uri",
"type":"STRING"
},
{
"name":"feature_type",
"type":"STRING"
},
{
"name":"transaction_timestamp",
"type":"STRING"
},
{
"name":"mid",
"type":"STRING"
},
{
"name":"description",
"type":"STRING"
},
{
"name":"score",
"type":"FLOAT"
},
{
"fields":[
{
"fields":[
{
"name":"x",
"type":"INTEGER"
},
{
"name":"y",
"type":"INTEGER"
}
],
"mode":"REPEATED",
"name":"vertices",
"type":"RECORD"
}
],
"name":"boundingPoly",
"type":"RECORD"
},
{
"fields":[
{
"fields":[
{
"name":"latitude",
"type":"FLOAT"
},
{
"name":"longitude",
"type":"FLOAT"
}
],
"name":"latLon",
"type":"RECORD"
}
],
"mode":"REPEATED",
"name":"locations",
"type":"RECORD"
}
]
```
7. View the annotation data produced by the API by running the following
`bq query` commands to see all the landmarks found in these six images
ordered by the most likely score:
bq query --nouse_legacy_sql "SELECT SPLIT(gcs_uri, '/')[OFFSET(3)] file_name, description, score, locations FROM ${BIGQUERY_DATASET}.landmark_annotation ORDER BY score DESC"
The output is similar to the following:
```
+---+---+---+---+
| file_name | description | score | locations |
+---+---+---+---+
| eiffel_tower.jpg | Eiffel Tower | 0.7251996 | ["POINT(2.2944813 48.8583701)"] |
| eiffel_tower.jpg | Trocadéro Gardens | 0.69601923 | ["POINT(2.2892823 48.8615963)"] |
| eiffel_tower.jpg | Champ De Mars | 0.6800974 | ["POINT(2.2986304 48.8556475)"] |
+---+---+---+---+
```
For detailed descriptions of all the columns that are specific to annotations, see
[`AnnotateImageResponse`](https://docs.cloud.google.com/vision/docs/reference/rest/v1/AnnotateImageResponse).
8. To stop the streaming pipeline, run the following command. The pipeline
continues to run even though there are no more Pub/Sub
notifications to process.
gcloud dataflow jobs cancel
--region ${REGION} $(gcloud dataflow jobs list
--region ${REGION} --filter="NAME:test-vision-analytics AND STATE:Running"
--format="get(JOB_ID)")
The following section contains more sample queries that analyze different
image features of the images.
## Analyzing a Flickr30K dataset
In this section, you detect labels and landmarks in the public
[Flickr30k image dataset](https://www.kaggle.com/hsankesara/flickr-image-dataset)
hosted on Kaggle.
1. In Cloud Shell, change the Dataflow pipeline
parameters so that it's optimized for a large dataset. To allow higher
throughput, also increase the `batchSize` and
`keyRange` values. Dataflow scales the number of workers as
needed:
./gradlew run --args=" \
--runner=DataflowRunner \
--jobName=vision-analytics-flickr \
--streaming \
--enableStreamingEngine \
--diskSizeGb=30 \
--autoscalingAlgorithm=THROUGHPUT_BASED \
--maxNumWorkers=5 \
--project=${PROJECT} \
--region=${REGION} \
--subscriberId=projects/${PROJECT}/subscriptions/${GCS_NOTIFICATION_SUBSCRIPTION} \
--visionApiProjectId=${PROJECT} \
--features=LABEL_DETECTION,LANDMARK_DETECTION \
--datasetName=${BIGQUERY_DATASET} \
--batchSize=16 \
--keyRange=5"
Because the dataset is large, you can't use Cloud Shell to
retrieve the images from Kaggle and send them to the Cloud Storage
bucket. You must use a VM with a larger disk size to do that.
2. To retrieve Kaggle-based images and send them to the
Cloud Storage bucket, follow the instructions in the
[Simulate the images being uploaded to the storage bucket](https://github.com/GoogleCloudPlatform/dataflow-vision-analytics/blob/master/README.md#simulate-the-images-being-uploaded-to-the-storage-bucket)
section in the GitHub repository.
3. To observe the progress of the copying process by looking at the custom
metrics available in the Dataflow UI, navigate to the
[Dataflow Jobs](https://console.cloud.google.com/dataflow/jobs)
page and select the *`vision-analytics-flickr`* pipeline. The customer
counters should change periodically until the Dataflow
pipeline processes all the files.
The output is similar to the following screenshot of the Custom Counters
panel. One of the files in the dataset
is of the wrong type, and the `rejectedFiles` counter reflects that. These
counter values are approximate. You might see higher numbers. Also, the
number of annotations will most likely change due to increased accuracy of
the processing by Vision API.
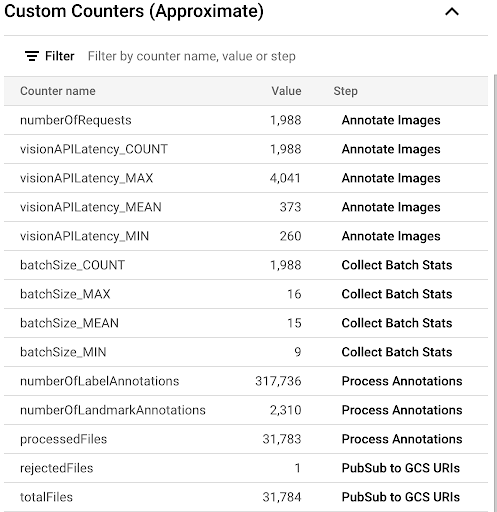
To determine whether you're approaching or exceeding the available
resources, see the Vision API quota page.
In our example, the Dataflow pipeline used only roughly
50% of its quota. Based on the percentage of the quota you use, you can
decide to increase the parallelism of the pipeline by increasing the value
of the `keyRange` parameter.
4. Shut down the pipeline:
gcloud dataflow jobs list --region $REGION --filter="NAME:vision-analytics-flickr AND STATE:Running" --format="get(JOB_ID)"
## Analyze annotations in BigQuery
In this deployment, you've processed more than 30,000 images for label and
landmark annotation. In this section, you gather statistics about those files.
You can run these queries in the GoogleSQL for
BigQuery workspace or you can use the bq command-line tool.
Be aware that the numbers that you see can vary from the sample query results
in this deployment. Vision API constantly improves the accuracy of its analysis;
it can produce richer results by analyzing the same image after you initially
test the solution.
1. In the Google Cloud console, go to the BigQuery
**Query editor** page and run the following command to view the top 20
labels in the dataset:
[Go to Query editor](https://console.cloud.google.com/bigquery)
SELECT description, count(*)ascount \
FROM vision_analytics.label_annotation
GROUP BY description ORDER BY count DESC LIMIT 20
The output is similar to the following:
```
+---+---+
| description | count |
+---+---+
| Leisure | 7663 |
| Plant | 6858 |
| Event | 6044 |
| Sky | 6016 |
| Tree | 5610 |
| Fun | 5008 |
| Grass | 4279 |
| Recreation | 4176 |
| Shorts | 3765 |
| Happy | 3494 |
| Wheel | 3372 |
| Tire | 3371 |
| Water | 3344 |
| Vehicle | 3068 |
| People in nature | 2962 |
| Gesture | 2909 |
| Sports equipment | 2861 |
| Building | 2824 |
| T-shirt | 2728 |
| Wood | 2606 |
+---+---+
```
2. Determine which other labels are present on an image with a particular
label, ranked by frequency:
DECLARE label STRING DEFAULT 'Plucked string instruments';
WITH other_labels AS (
SELECT description, COUNT(*) count
FROM vision_analytics.label_annotation
WHERE gcs_uri IN (
SELECT gcs_uri FROM vision_analytics.label_annotation WHERE description = label )
AND description != label
GROUP BY description)
SELECT description, count, RANK() OVER (ORDER BY count DESC) rank
FROM other_labels ORDER BY rank LIMIT 20;
The output is as follows. For the *Plucked string instruments* label used in
the preceding command, you should see:
```
+---+---+---+
| description | count | rank |
+---+---+---+
| String instrument | 397 | 1 |
| Musical instrument | 236 | 2 |
| Musician | 207 | 3 |
| Guitar | 168 | 4 |
| Guitar accessory | 135 | 5 |
| String instrument accessory | 99 | 6 |
| Music | 88 | 7 |
| Musical instrument accessory | 72 | 8 |
| Guitarist | 72 | 8 |
| Microphone | 52 | 10 |
| Folk instrument | 44 | 11 |
| Violin family | 28 | 12 |
| Hat | 23 | 13 |
| Entertainment | 22 | 14 |
| Band plays | 21 | 15 |
| Jeans | 17 | 16 |
| Plant | 16 | 17 |
| Public address system | 16 | 17 |
| Artist | 16 | 17 |
| Leisure | 14 | 20 |
+---+---+---+
```
3. View the top 10 detected landmarks:
SELECT description, COUNT(description) AS count
FROM vision_analytics.landmark_annotation
GROUP BY description ORDER BY count DESC LIMIT 10
The output is as follows:
```
+---+---+
| description | count |
+---+---+
| Times Square | 55 |
| Rockefeller Center | 21 |
| St. Mark's Square | 16 |
| Bryant Park | 13 |
| Millennium Park | 13 |
| Ponte Vecchio | 13 |
| Tuileries Garden | 13 |
| Central Park | 12 |
| Starbucks | 12 |
| National Mall | 11 |
+---+---+
```
4. Determine the images that most likely contain waterfalls:
SELECT SPLIT(gcs_uri, '/')[OFFSET(3)] file_name, description, score
FROM vision_analytics.landmark_annotation
WHERE LOWER(description) LIKE '%fall%'
ORDER BY score DESC LIMIT 10
The output is as follows:
```
+---+---+---+
| file_name | description | score |
+---+---+---+
| 895502702.jpg | Waterfall Carispaccha | 0.6181358 |
| 3639105305.jpg | Sahalie Falls Viewpoint | 0.44379658 |
| 3672309620.jpg | Gullfoss Falls | 0.41680416 |
| 2452686995.jpg | Wahclella Falls | 0.39005348 |
| 2452686995.jpg | Wahclella Falls | 0.3792498 |
| 3484649669.jpg | Kodiveri Waterfalls | 0.35024035 |
| 539801139.jpg | Mallela Thirtham Waterfall | 0.29260656 |
| 3639105305.jpg | Sahalie Falls | 0.2807213 |
| 3050114829.jpg | Kawasan Falls | 0.27511594 |
| 4707103760.jpg | Niagara Falls | 0.18691841 |
+---+---+---+
```
5. Find images of landmarks within 3 kilometers of the Colosseum in Rome
(the `ST_GEOPOINT` function uses the Colosseum's longitude and latitude):
WITH
landmarksWithDistances AS (
SELECT
gcs_uri,
description,
location,
ST_DISTANCE(location,
ST_GEOGPOINT(12.492231,
41.890222)) distance_in_meters,
FROM
`vision_analytics.landmark_annotation` landmarks
CROSS JOIN
UNNEST(landmarks.locations) AS location )
SELECT
SPLIT(gcs_uri,"/")[OFFSET(3)] file,
description,
ROUND(distance_in_meters) distance_in_meters,
location,
CONCAT("https://storage.cloud.google.com/", SUBSTR(gcs_uri, 6)) AS image_url
FROM
landmarksWithDistances
WHERE
distance_in_meters < 3000
ORDER BY
distance_in_meters
LIMIT
100
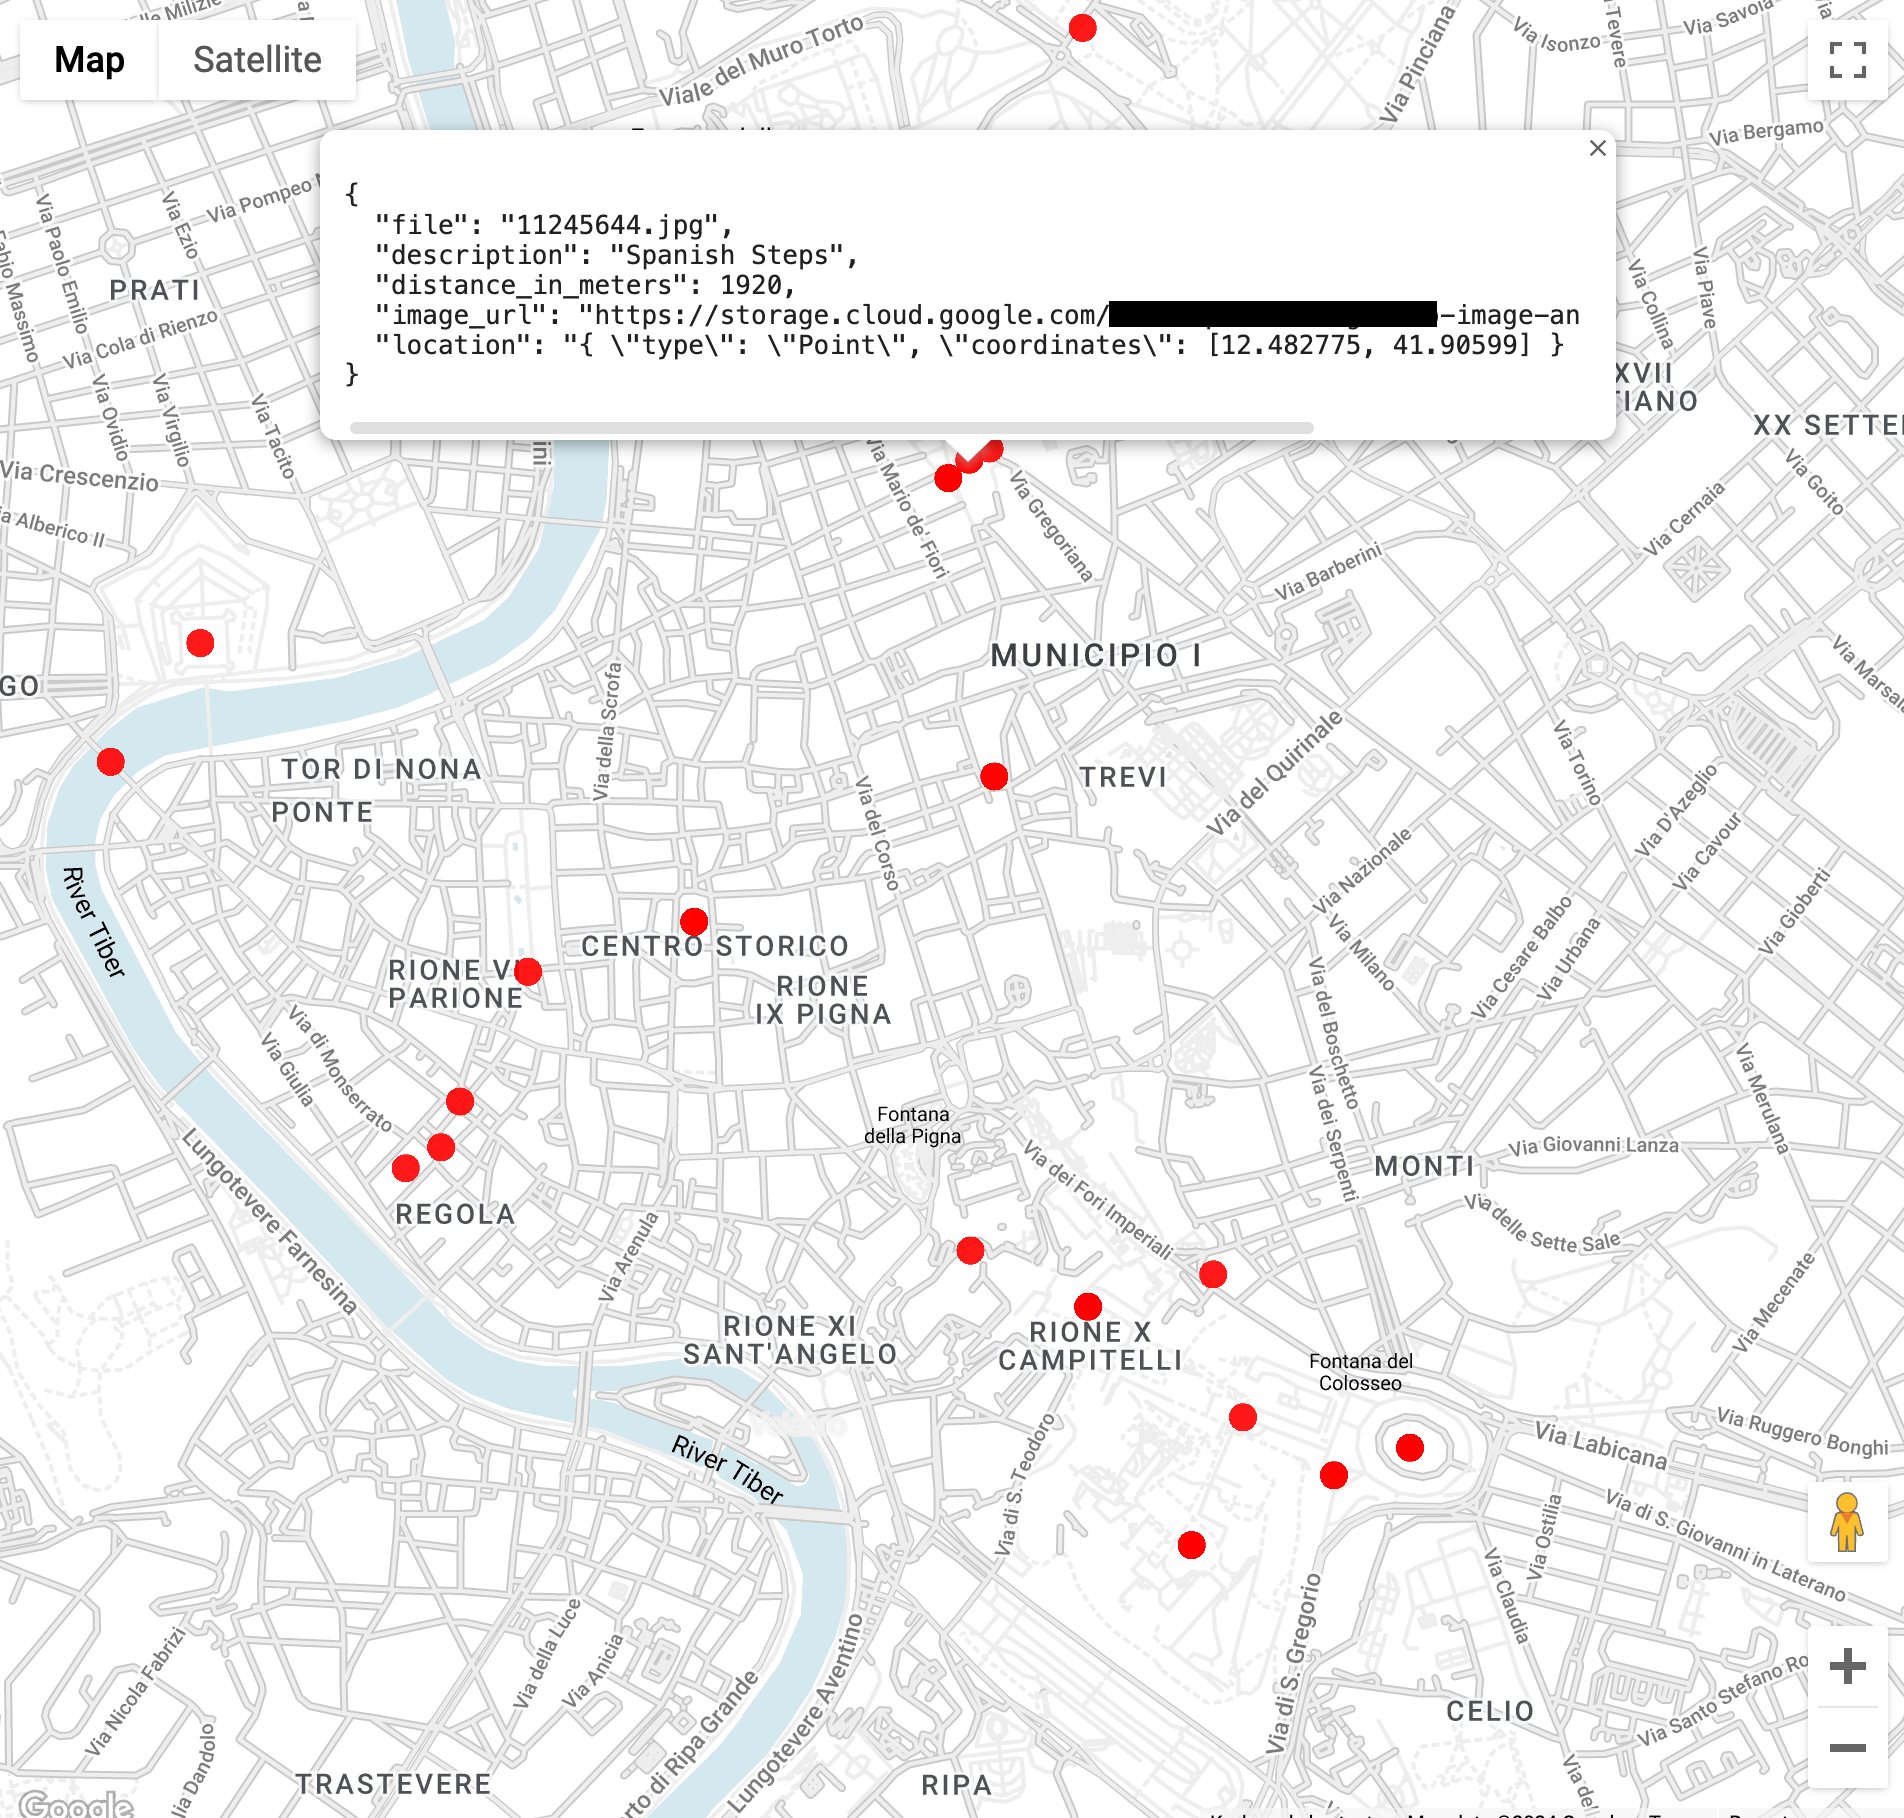
When you run the query you will see that there are multiple images of the
Colosseum, but also images of the Arch Of Constantine, the Palatine Hill,
and a number of other frequently photographed places.
You can visualize the data in
[BigQuery Geo Viz](https://bigquerygeoviz.appspot.com/)
by pasting in the previous query. Select a point on the map, to see
its details. The `Image_url` attribute contains a link to the image file.
One note on query results. Location information is usually present for
landmarks. The same image can contain multiple locations of the same landmark.
This functionality is described in the
[`AnnotateImageResponse`](https://docs.cloud.google.com/vision/docs/reference/rest/v1/AnnotateImageResponse#EntityAnnotation)
type.
Because one location can indicate the location of the scene in the image,
multiple
[`LocationInfo`](https://docs.cloud.google.com/vision/docs/reference/rest/v1/AnnotateImageResponse#locationinfo)
elements can be present. Another location can indicate where the image was
taken.
## Clean up
To avoid incurring charges to your Google Cloud account for the resources
used in this guide, either delete the project that contains the resources, or
keep the project and delete the individual resources.
### Delete the Google Cloud project
The easiest way to eliminate billing is to delete the Google Cloud project
you created for the tutorial.
> [!CAUTION]
> **Caution** : Deleting a project has the following effects:
>
> - **Everything in the project is deleted.** If you used an existing project for the tasks in this document, when you delete it, you also delete any other work you've done in the project.
> - **Custom project IDs are lost.** When you created this project, you might have created a custom project ID that you want to use in the future. To preserve the URLs that use the project ID, such as an `appspot.com` URL, delete selected resources inside the project instead of deleting the whole project.
>
>
> If you plan to explore multiple architectures, tutorials, or quickstarts, reusing projects
> can help you avoid exceeding project quota limits.
1. In the Google Cloud console, go to the **Manage resources** page.
[Go to Manage resources](https://console.cloud.google.com/iam-admin/projects)
2. In the project list, select the project that you want to delete, and then click **Delete**.
3. In the dialog, type the project ID, and then click **Shut down** to delete the project.
If you decide to delete resources individually, follow the steps in the
[Clean up](https://github.com/GoogleCloudPlatform/dataflow-vision-analytics/blob/master/README.md#clean-up)
section of the GitHub repository.
## What's next
- For more reference architectures, diagrams, and best practices, explore the [Cloud Architecture Center](https://docs.cloud.google.com/architecture).
## Contributors
Authors:
- [Masud Hasan](https://www.linkedin.com/in/masudhasan1480) \| Site Reliability Engineering Manager
- [Sergei Lilichenko](https://www.linkedin.com/in/sergei-lilichenko) \| Solutions Architect
- [Lakshmanan Sethu](https://www.linkedin.com/in/lakshmanansethu) \| Technical Account Manager
Other contributors:
- [Jiyeon Kang](https://www.linkedin.com/in/jiyeon-kang) \| Customer Engineer
- [Sunil Kumar Jang Bahadur](https://www.linkedin.com/in/sunilkumar88) \| Customer Engineer