*This page
applies to **Apigee** and **Apigee hybrid**.*
*View [Apigee Edge](https://docs.apigee.com/api-platform/troubleshoot/support-d) documentation.*
> [!NOTE]
> **Note:** This document is applicable for Apigee hybrid users only. If you get the API proxy deployments fail with **No active runtime pods** warning in Apigee, contact [Google Cloud Customer Care](https://cloud.google.com/support-hub/) to resolve it.
## Symptoms
Deployments of API proxies fail with **No active runtime pods** warning in the Apigee hybrid
UI.
## Error messages
The **No active runtime pods** warning is displayed in the **Details**
dialog next to the error message **Deployment issues on ENVIRONMENT:
REVISION_NUMBER** on the API proxy page:
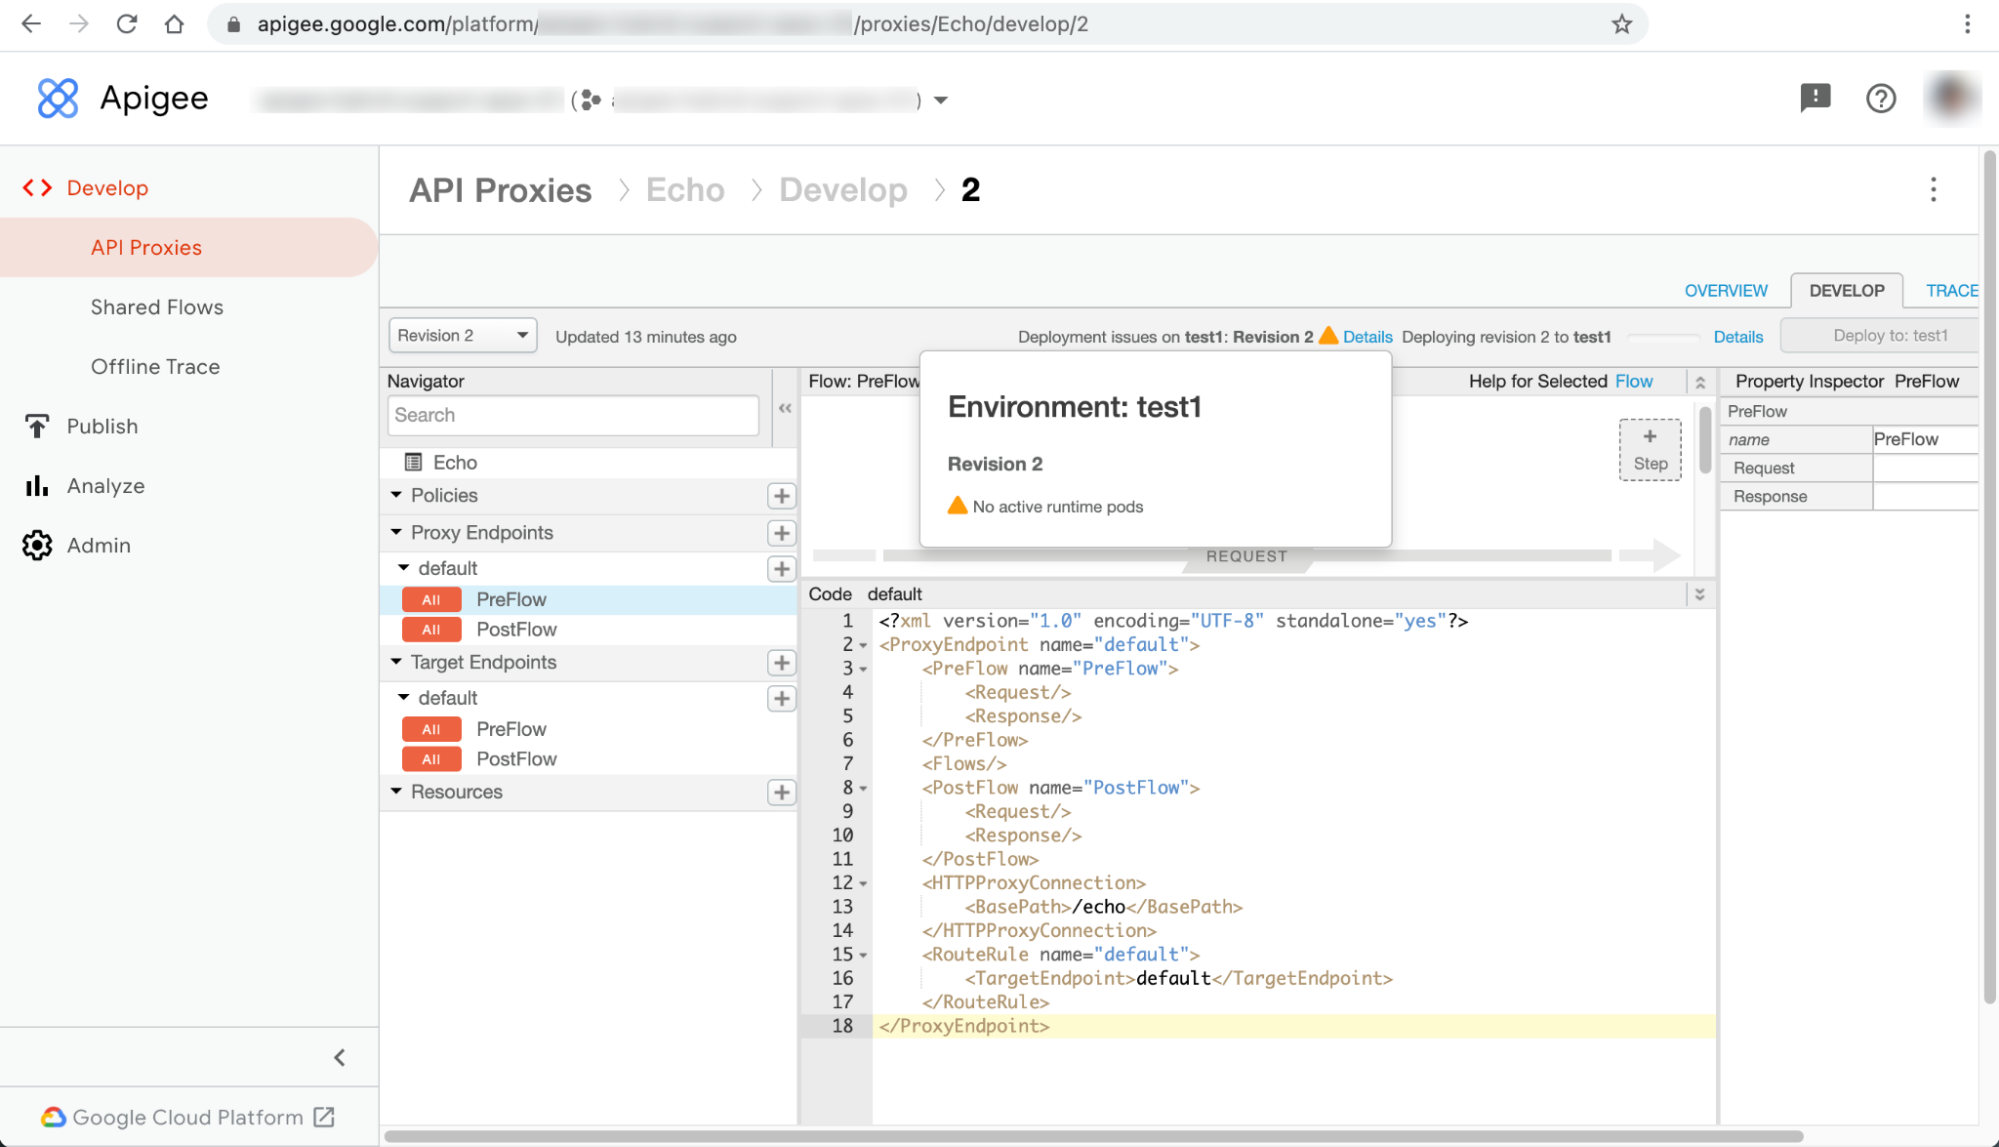
This issue can manifest as different errors in other resource pages of the UI. Here are
some example error messages:
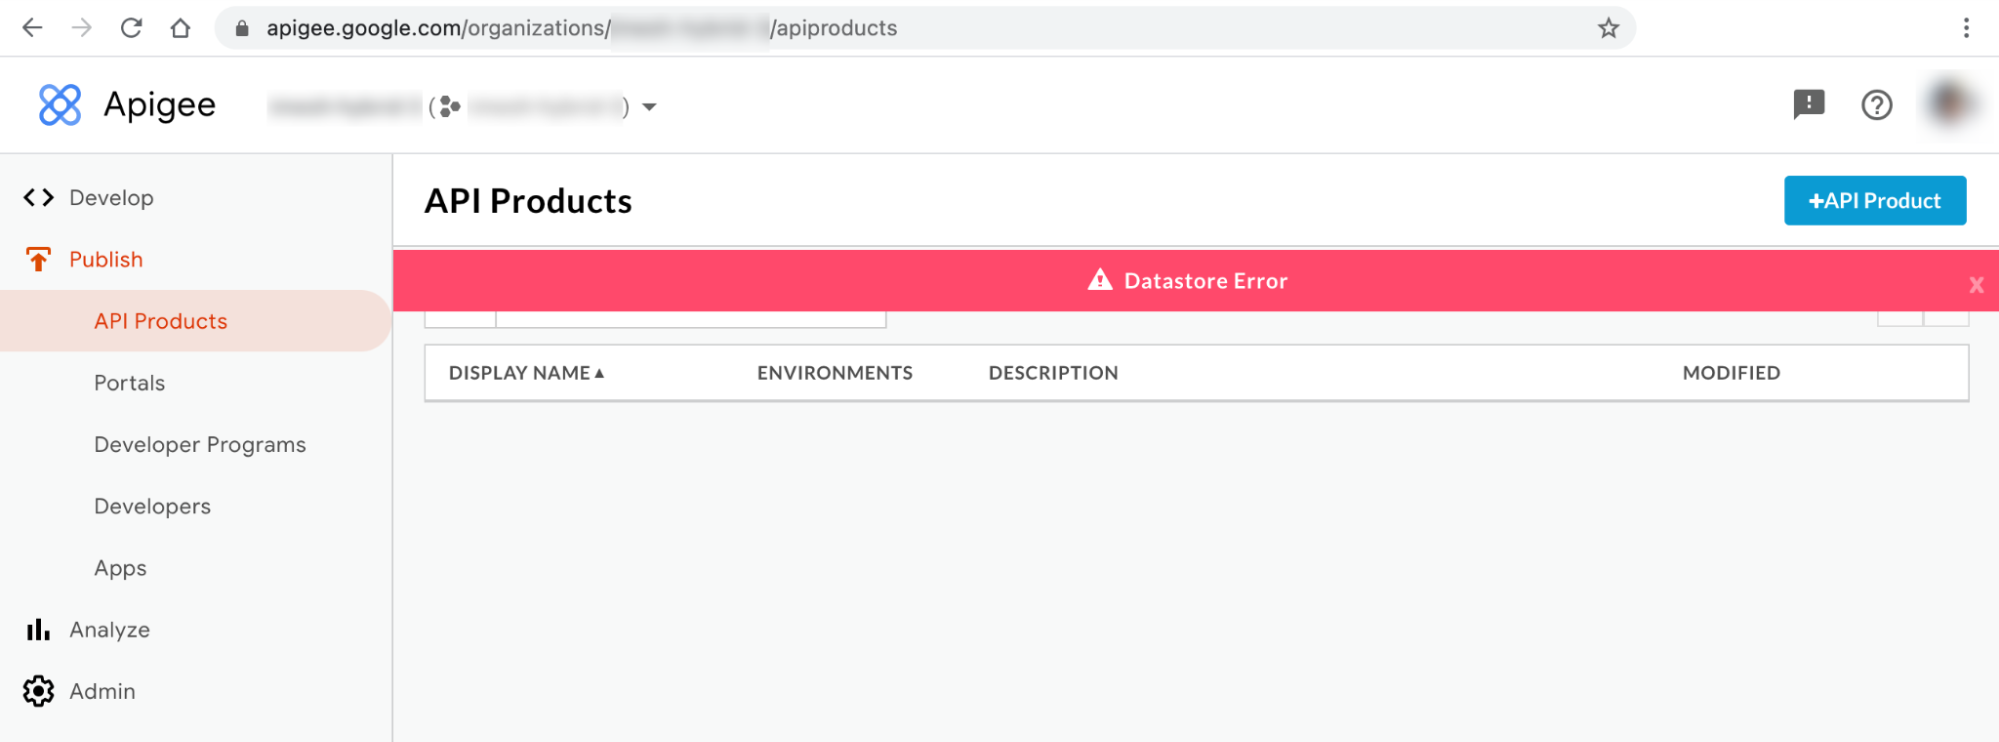
### Hybrid UI error message #1: Datastore Error
You may observe the **Datastore Error** on the **API Products** and **Apps**
pages of the hybrid UI as shown below:
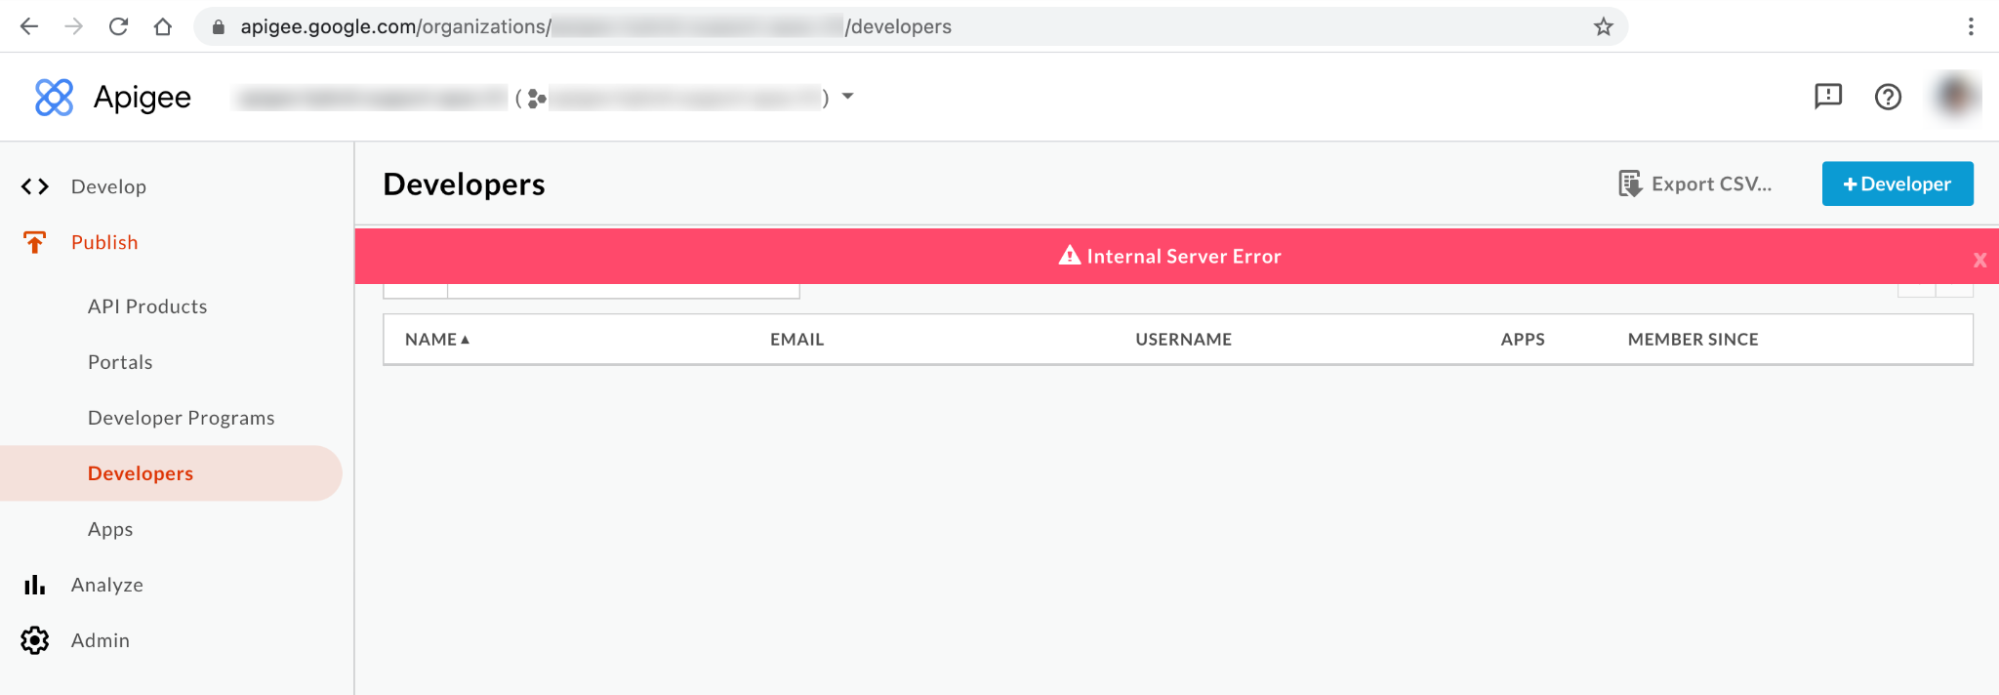
### Hybrid UI error message #2: Internal Server Error
You may observe **Internal Server Error** on the **Developers** page of the UI as shown below:
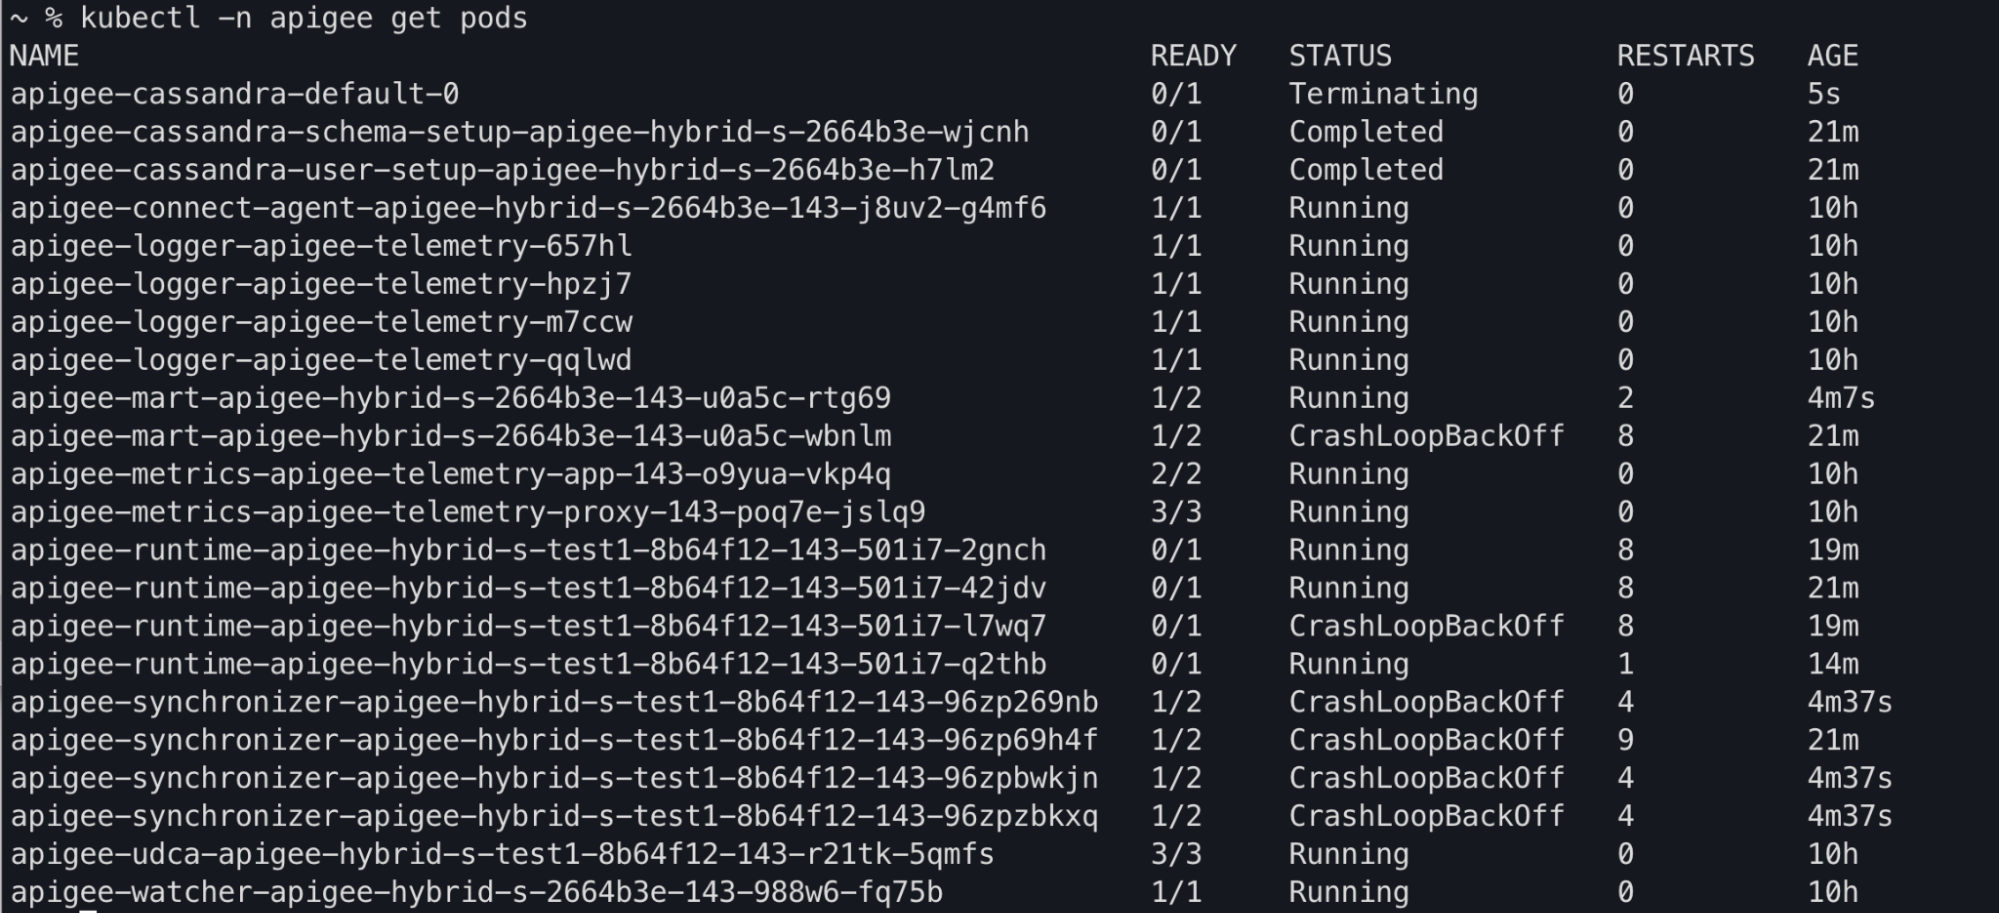
### Kubectl command output
You may observe `apiege-mart`, `apigee-runtime` and `apigee-
synchronizer` pod statuses being changed to `CrashLoopBackOff `in the
`kubectl get pods` command output:
### Component log error messages
You will observe the following liveness probe failure errors in the `apigee-runtime`
pod logs in Apigee hybrid releases \>= 1.4.0:
```
{"timestamp":"1621575431454","level":"ERROR","thread":"qtp365724939-205","mdc":{"targetpath":"/v1/pr
obes/live"},"logger":"REST","message":"Error occurred : probe failed Probe cps-datastore-
connectivity-liveliness-probe failed due to com.apigee.probe.model.ProbeFailedException{ code =
cps.common.datastoreConnectionNotHealthy, message = Datastore connection not healthy, associated
contexts =
[]}\n\n\tcom.apigee.probe.ProbeAPI.getResponse(ProbeAPI.java:66)\n\tcom.apigee.probe.ProbeAPI.getLiv
eStatus(ProbeAPI.java:55)\n\tsun.reflect.GeneratedMethodAccessor52.invoke(Unknown
Source)\n\tsun.reflect.DelegatingMethodAccessorImpl.invoke(DelegatingMethodAccessorImpl.java:43)\n\t
","context":"apigee-service-
logs","severity":"ERROR","class":"com.apigee.rest.framework.container.ExceptionMapper","method":"toR
esponse"}
{"timestamp":"1621575431454","level":"ERROR","thread":"qtp365724939-205","mdc":{"targetpath":"/v1/pr
obes/live"},"logger":"REST","message":"Returning error response : ErrorResponse{errorCode =
probe.ProbeRunError, errorMessage = probe failed Probe cps-datastore-connectivity-liveliness-probe
failed due to com.apigee.probe.model.ProbeFailedException{ code =
cps.common.datastoreConnectionNotHealthy, message = Datastore connection not healthy, associated
contexts = []}}","context":"apigee-service-
logs","severity":"ERROR","class":"com.apigee.rest.framework.container.ExceptionMapper","method":"toR
esponse"}
```
You will observe the following `Cannot build a cluster without contact points `error
in `apigee-synchronizer` pod logs in Apigee hybrid releases \>= 1.4.0:
```
{"timestamp":"1621575636434","level":"ERROR","thread":"main","logger":"KERNEL.DEPLOYMENT","message":
"ServiceDeployer.deploy() : Got a life cycle exception while starting service [SyncService, Cannot
build a cluster without contact points] : {}","context":"apigee-service-
logs","exception":"java.lang.IllegalArgumentException: Cannot build a cluster without contact
points\n\tat com.datastax.driver.core.Cluster.checkNotEmpty(Cluster.java:134)\n\tat
com.datastax.driver.core.Cluster.(Cluster.java:127)\n\tat
com.datastax.driver.core.Cluster.buildFrom(Cluster.java:193)\n\tat
com.datastax.driver.core.Cluster$Builder.build(Cluster.java:1350)\n\tat
io.apigee.persistence.PersistenceContext.newCluster(PersistenceContext.java:214)\n\tat
io.apigee.persistence.PersistenceContext.(PersistenceContext.java:48)\n\tat
io.apigee.persistence.ApplicationContext.(ApplicationContext.java:19)\n\tat
io.apigee.runtimeconfig.service.RuntimeConfigServiceImpl.(RuntimeConfigServiceImpl.java:75)
\n\tat
io.apigee.runtimeconfig.service.RuntimeConfigServiceFactory.newInstance(RuntimeConfigServiceFactory.
java:99)\n\tat
io.apigee.common.service.AbstractServiceFactory.initializeService(AbstractServiceFactory.java:301)\n
\tat
...","severity":"ERROR","class":"com.apigee.kernel.service.deployment.ServiceDeployer","method":"sta
rtService"}
```
You will observe the following liveness probe failure errors in the `apigee-mart` pod
logs in Apigee hybrid releases \>= 1.4.0:
```
{"timestamp":"1621576757592","level":"ERROR","thread":"qtp991916558-144","mdc":{"targetpath":"/v1/pr
obes/live"},"logger":"REST","message":"Error occurred : probe failed Probe cps-datastore-
connectivity-liveliness-probe failed due to com.apigee.probe.model.ProbeFailedException{ code =
cps.common.datastoreConnectionNotHealthy, message = Datastore connection not healthy, associated
contexts =
[]}\n\n\tcom.apigee.probe.ProbeAPI.getResponse(ProbeAPI.java:66)\n\tcom.apigee.probe.ProbeAPI.getLiv
eStatus(ProbeAPI.java:55)\n\tsun.reflect.NativeMethodAccessorImpl.invoke0(Native
Method)\n\tsun.reflect.NativeMethodAccessorImpl.invoke(NativeMethodAccessorImpl.java:62)\n\t","conte
xt":"apigee-service-
logs","severity":"ERROR","class":"com.apigee.rest.framework.container.ExceptionMapper","method":"toR
esponse"}
{"timestamp":"1621576757593","level":"ERROR","thread":"qtp991916558-144","mdc":{"targetpath":"/v1/pr
obes/live"},"logger":"REST","message":"Returning error response : ErrorResponse{errorCode =
probe.ProbeRunError, errorMessage = probe failed Probe cps-datastore-connectivity-liveliness-probe
failed due to com.apigee.probe.model.ProbeFailedException{ code =
cps.common.datastoreConnectionNotHealthy, message = Datastore connection not healthy, associated
contexts = []}}","context":"apigee-service-
logs","severity":"ERROR","class":"com.apigee.rest.framework.container.ExceptionMapper","method":"toR
esponse"}
```
### Information about No active runtime pods error
In the Apigee hybrid 1.4.0 release, the liveness probe feature was added to the
`apigee-runtime` and `apigee-mart` pods to check the status of the
Cassandra pods. If all Cassandra pods become unavailable, then the liveness probes of the
`apigee-runtime` and `apigee-mart `pods will fail. Thus, the
`apigee-runtime `and `apigee-mart `pods will go into the
`CrashLoopBackOff `state causing deployments of API proxies to fail with the warning
`No active runtime pods`.
The `apigee-synchronizer` pod will also go to the `CrashLoopBackOff `state
because of Cassandra pods being unavailable.
## Possible causes
Here are a few possible causes for this error:
| Cause | Description |
|---|---|
| [Cassandra pods are down](https://docs.cloud.google.com/apigee/docs/api-platform/troubleshoot/playbooks/deployment/no-active-runtime-pods-warning.md.txt#cassandra-pods-down) | Cassandra pods are down; therefore, `apigee-runtime` pods will not be able to communicate with the Cassandra database. |
| [Cassandra replica configured with only one pod](https://docs.cloud.google.com/apigee/docs/api-platform/troubleshoot/playbooks/deployment/no-active-runtime-pods-warning.md.txt#cassandra-replica-one-pod) | Having only one Cassandra pod could become a single point of failure. |
### Cause: Cassandra pods are down
During the API proxy deployment process, the `apigee-runtime` pods connect to the
Cassandra database to fetch resources, such as Key Value Maps (KVMs) and caches, defined in the API proxy. If there are no
Cassandra pods running, then `apigee-runtime` pods will not be able to connect to the
Cassandra database. This leads to the API Proxy deployment failure.
#### Diagnosis
1. List Cassandra pods:
```
kubectl -n apigee get pods -l app=apigee-cassandra
```
**Sample output 1:**
```
NAME READY STATUS RESTARTS AGE
apigee-cassandra-default-0 0/1 Pending 0 9m23s
```
> [!NOTE]
> **Note:** This sample output shows that Cassandra pod is in `Pending` state.
**Sample output 2:**
```
NAME READY STATUS RESTARTS AGE
apigee-cassandra-0 0/1 CrashLoopBackoff 0 10m
```
> [!NOTE]
> **Note:** This sample output shows that Cassandra pod is in `CrashLoopBackoff` state.
2. Verify the status of each Cassandra pod. The status of all Cassandra pods should be in the `Running` state. If any of the Cassandra pods are in a different state, that could be the reason for this issue. Perform the following steps to resolve the issue:
#### Resolution
1. If any of the Cassandra pods are in the `Pending` state, refer to [Cassandra pods are stuck in the Pending state](https://docs.cloud.google.com/apigee/docs/api-platform/troubleshoot/playbooks/cassandra/ts-cassandra.md.txt#cassandra-pods-are-stuck-in-the-pending-state) to troubleshoot and resolve the issue.
2. If any of the Cassandra pods are in `CrashLoopBackoff` state, refer to [Cassandra pods are stuck in the CrashLoopBackoff state](https://docs.cloud.google.com/apigee/docs/api-platform/troubleshoot/playbooks/cassandra/ts-cassandra.md.txt#cassandra-pods-are-stuck-in-the-crashloopbackoff-state) to troubleshoot and resolve the issue.
> [!NOTE]
> **Note:** Once Cassandra pods become healthy, `apigee-runtime`, `apigee-mart` and `apigee-synchronizer `pods will recover and their status will change to `Running`.
**Sample output:**
```
kubectl -n apigee get pods -l app=apigee-runtime
NAME READY STATUS RESTARTS AGE
apigee-runtime-apigee-hybrid-s-test1-8b64f12-143-501i7-2gnch 1/1 Running 13 43m
apigee-runtime-apigee-hybrid-s-test1-8b64f12-143-501i7-42jdv 1/1 Running 13 45m
apigee-runtime-apigee-hybrid-s-test1-8b64f12-143-501i7-l7wq7 1/1 Running 13 43m
apigee-runtime-apigee-hybrid-s-test1-8b64f12-143-501i7-q2thb 1/1 Running 8 38m
```
```
kubectl -n apigee get pods -l app=apigee-mart
NAME READY STATUS RESTARTS AGE
apigee-mart-apigee-hybrid-s-2664b3e-143-u0a5c-rtg69 2/2 Running 8 28m
```
```
kubectl -n apigee get pods -l app=apigee-synchronizer
NAME READY STATUS RESTARTS AGE
apigee-synchronizer-apigee-hybrid-s-test1-8b64f12-143-96zp269nb 2/2 Running 10 29m
apigee-synchronizer-apigee-hybrid-s-test1-8b64f12-143-96zp2w2jp 2/2 Running 0 4m40s
apigee-synchronizer-apigee-hybrid-s-test1-8b64f12-143-96zpkfkvq 2/2 Running 0 4m40s
apigee-synchronizer-apigee-hybrid-s-test1-8b64f12-143-96zpxmzhn 2/2 Running 0 4m40s
```
### Cause: Cassandra replica configured with only one pod
If Cassandra replica count is configured to one, there will only be one Cassandra pod available
in the runtime. As a result, `apigee-runtime` pods may encounter connectivity issues
if that Cassandra pod becomes unavailable for a certain time period.
#### Diagnosis
1. Get the Cassandra stateful set and check the current replica count:
```
kubectl -n apigee get statefulsets -l app=apigee-cassandra
```
**Sample output:**
```
NAME READY AGE
apigee-cassandra-default 1/1 21m
```
> [!NOTE]
> **Note:** The above sample output shows that the replica count is configured with a value of 1 (refer to the field READY).
2. If the replica count is configured to 1, then perform the following steps to increase it to a higher number.
#### Resolution
Apigee hybrid non-production deployments may have
Cassandra replica count set to 1. If high availability of Cassandra is important in non-
production deployments, increase the replica count to 3 to resolve this problem.
Perform the following steps to resolve this issue:
1. Update the `overrides.yaml` file and set Cassandra replica count to 3:
```
cassandra:
replicaCount: 3
```
For Cassandra configuration information, see
[Configuration property reference](https://docs.cloud.google.com/apigee/docs/hybrid/latest/config-prop-ref#cassandra).
2. Apply the above configuration using [Helm](https://docs.cloud.google.com/apigee/docs/hybrid/latest/helm-reference):
Dry run:
```
helm upgrade datastore apigee-datastore/ \
--install \
--namespace APIGEE_NAMESPACE \
--atomic \
-f OVERRIDES_FILE \
--dry-run
```
Install the Helm chart
```
helm upgrade datastore apigee-datastore/ \
--install \
--namespace APIGEE_NAMESPACE \
--atomic \
-f OVERRIDES_FILE
```
3. Get the Cassandra stateful set and check the current replica count:
```
kubectl -n get statefulsets -l app=apigee-cassandra
```
**Sample output:**
```
NAME READY AGE
apigee-cassandra-default 3/3 27m
```
4. Get the Cassandra pods and check the current instance count. If all pods are not ready and in the `Running` state wait for the new Cassandra pods to be created and activated:
```
kubectl -n get pods -l app=apigee-cassandra
```
**Sample output:**
```
NAME READY STATUS RESTARTS AGE
apigee-cassandra-default-0 1/1 Running 0 29m
apigee-cassandra-default-1 1/1 Running 0 21m
apigee-cassandra-default-2 1/1 Running 0 19m
```
**Note:** Once Cassandra pods become healthy, `apigee-runtime`, `apigee-mart` and `apigee-synchronizer `pods will recover and their status will change to `Running`.
**Sample output:**
```
kubectl -n apigee get pods -l app=apigee-runtime
NAME READY STATUS RESTARTS AGE
apigee-runtime-apigee-hybrid-s-test1-8b64f12-143-501i7-2gnch 1/1 Running 13 43m
apigee-runtime-apigee-hybrid-s-test1-8b64f12-143-501i7-42jdv 1/1 Running 13 45m
apigee-runtime-apigee-hybrid-s-test1-8b64f12-143-501i7-l7wq7 1/1 Running 13 43m
apigee-runtime-apigee-hybrid-s-test1-8b64f12-143-501i7-q2thb 1/1 Running 8 38m
```
```
kubectl -n apigee get pods -l app=apigee-mart
NAME READY STATUS RESTARTS AGE
apigee-mart-apigee-hybrid-s-2664b3e-143-u0a5c-rtg69 2/2 Running 8 28m
```
```
kubectl -n apigee get pods -l app=apigee-synchronizer
NAME READY STATUS RESTARTS AGE
apigee-synchronizer-apigee-hybrid-s-test1-8b64f12-143-96zp269nb 2/2 Running 10 29m
apigee-synchronizer-apigee-hybrid-s-test1-8b64f12-143-96zp2w2jp 2/2 Running 0 4m40s
apigee-synchronizer-apigee-hybrid-s-test1-8b64f12-143-96zpkfkvq 2/2 Running 0 4m40s
apigee-synchronizer-apigee-hybrid-s-test1-8b64f12-143-96zpxmzhn 2/2 Running 0 4m40s
```
## Must gather diagnostic information
If the problem persists even after following the above instructions, gather the following
diagnostic information, and then contact [Google Cloud Customer Care](https://cloud.google.com/support-hub/).
1. Google Cloud Project ID
2. Apigee hybrid/Apigee organization
3. For Apigee hybrid: the `overrides.yaml`, masking any sensitive information
4. Kubernetes pod status in all namespaces:
```
kubectl get pods -A > kubectl-pod-status`date +%Y.%m.%d_%H.%M.%S`.txt
```
5. Kubernetes cluster-info dump:
```
# generate kubernetes cluster-info dump
kubectl cluster-info dump -A --output-directory=/tmp/kubectl-cluster-info-dump
# zip kubernetes cluster-info dump
zip -r kubectl-cluster-info-dump`date +%Y.%m.%d_%H.%M.%S`.zip /tmp/kubectl-cluster-info-dump/*
```
## References
- [Scaling Cassandra horizontally](https://cloud.google.com/apigee/docs/hybrid/latest/cassandra-scaling#scaling-cassandra-horizontally)
- [Kubernetes Application Introspection and Debugging](https://kubernetes.io/docs/tasks/debug-application-cluster/debug-application-introspection/)
- [kubectl Cheat Sheet](https://kubernetes.io/docs/reference/kubectl/cheatsheet/)