*This page
applies to **Apigee** and **Apigee hybrid**.*
*View [Apigee Edge](https://docs.apigee.com/api-platform/get-started/what-apigee-edge) documentation.*

This page describes how to view and investigate detected anomalies using the
operations anomalies dashboard. You can investigate the anomaly and take appropriate action if
necessary. You can also
[create an anomaly alert](https://docs.cloud.google.com/apigee/docs/api-platform/analytics/create-operations-anomalies-alerts.md.txt) to
notify you if similar events occur in the future.
A detected anomaly includes the following information:
- The metric that caused the anomaly, such as proxy latency or an HTTP error code.
- The severity of the anomaly. The severity can be slight, moderate, or severe, based on its confidence level in the model. A low confidence level indicates that the severity is slight, while a high confidence level indicates that it is severe.
## View anomalies
The operations anomalies dashboard in the Apigee UI is your primary source of information about
detected operations anomalies. The dashboard displays a list of recent anomalies.
To open the operations anomalies dashboard:
1. In the Google Cloud console, go to the **Analytics \> Operations anomalies** page.
[Go to Operations anomalies](https://console.cloud.google.com/apigee/aapi-ops/operations-anomalies)
2. [Switch to the organization](https://docs.cloud.google.com/apigee/docs/api-platform/get-started/switch-org.md.txt) that you want to monitor.
This displays the operations anomalies dashboard.
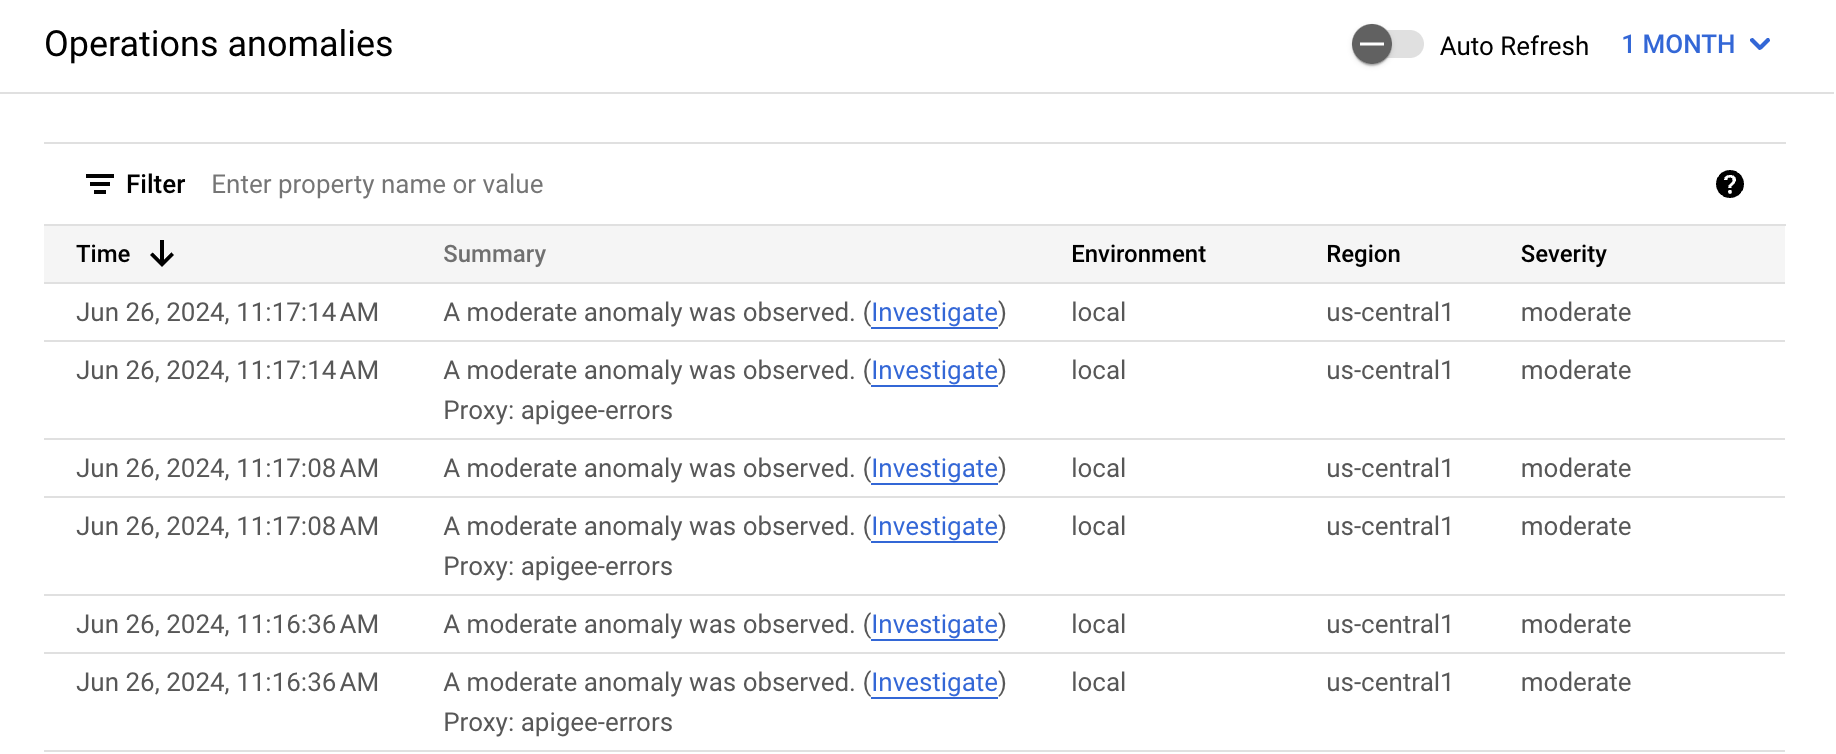
By default, the dashboard shows anomalies that have occurred during the previous hour.
If no anomalies have been detected during that time period, no rows are
displayed in the dashboard. You can select a larger time range from
the time range menu in the top right of the dashboard.
Each row in the table corresponds to a detected anomaly,
and displays the following information:
- The date and time of the anomaly.
- A brief summary of the anomaly, including the proxy in which it occurred.
- The environment in which the anomaly occurred.
- The region where the anomaly occurred.
- The severity of the anomaly event: slight, moderate, or severe. Severity is based on a statistical measure (p-value) of how unlikely it would be for the event to occur by chance (the more unlikely the event, the greater its severity).
## Investigate anomalies
When you see an anomaly in the operations anomalies dashboard, you can investigate it further
in the [API Monitoring](https://docs.cloud.google.com/apigee/docs/api-monitoring.md.txt) dashboards. Click **Investigate**
in the **Summary** column for the anomaly to open the
[API Monitoring Investigate dashboard](https://docs.cloud.google.com/apigee/docs/api-monitoring/investigate.md.txt).
The dashboards display graphs and tables of recent API data, which provide highly specific information about what was occurring in the API at the time of the anomaly.
### Example: Investigate a fault code anomaly
Suppose you are looking at the operations anomalies
dashboard and you notice the anomaly shown below:

After clicking **Investigate** in the **Summary** column, the
[API Monitoring Investigate dashboard](https://docs.cloud.google.com/apigee/docs/api-monitoring/investigate.md.txt),
is shown below.
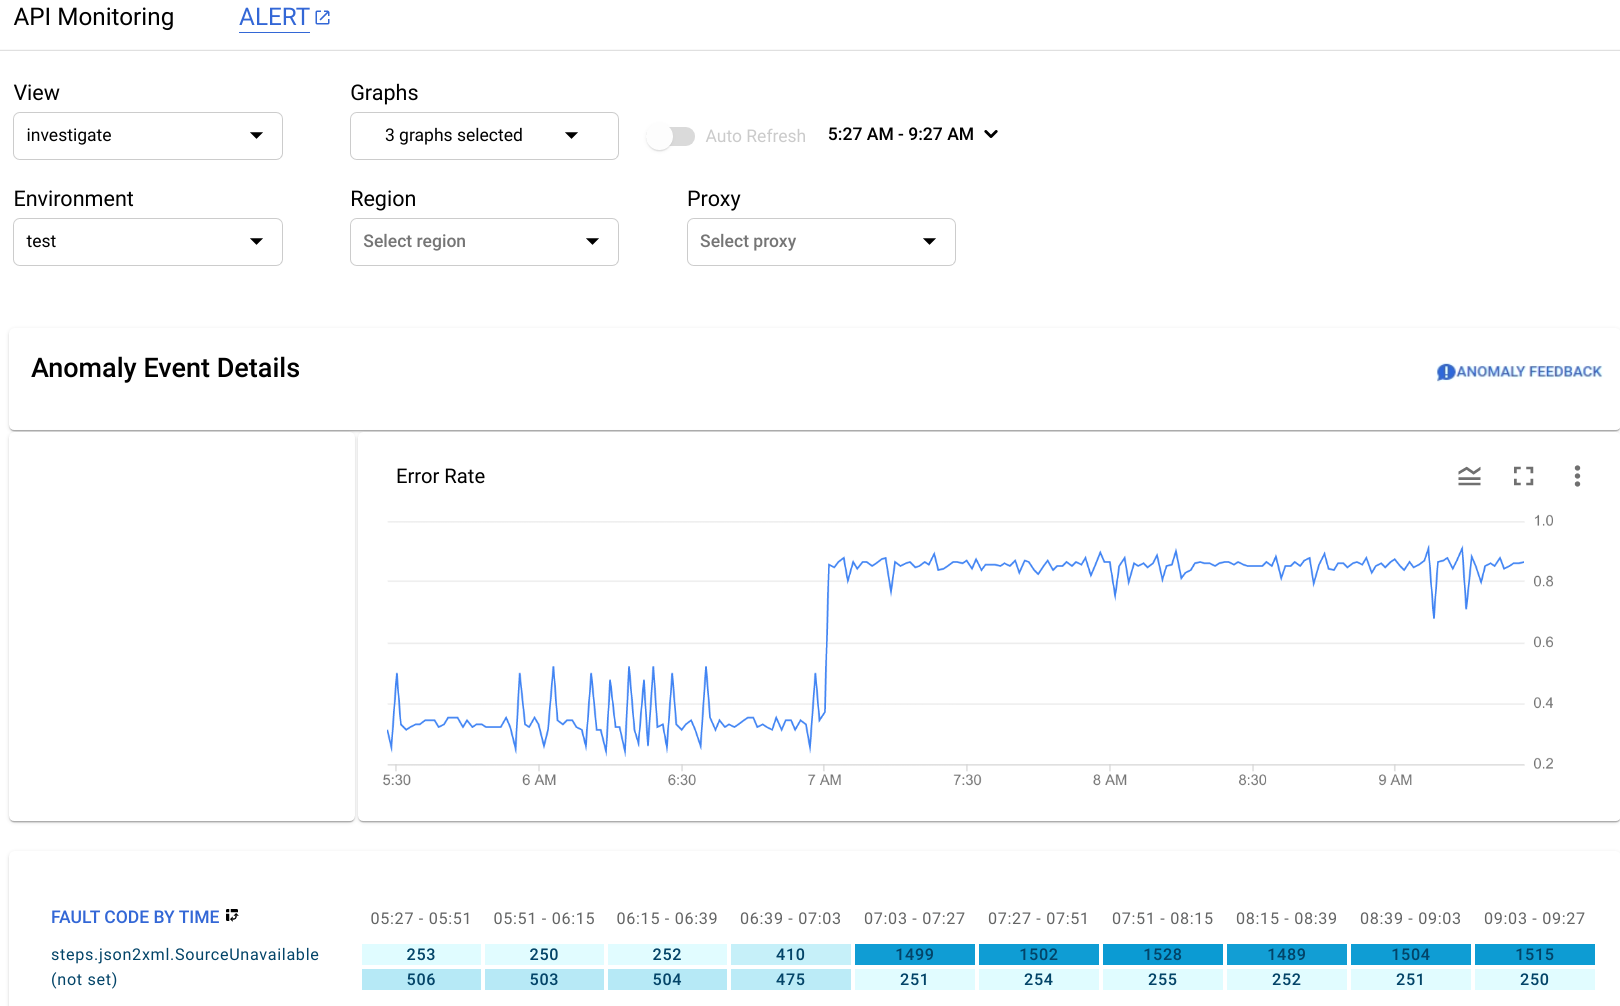
The Anomaly Event Details pane displays an error rate timeline.
The graph shows that the anomaly occurred after 07:00 AM, when the error rate
jumped from less than 0.4 to more than 0.8.
The error rate in the timeline graph includes errors for all fault codes.
To see a breakdown
of errors for different fault codes, look at the Fault Code by Time graph displayed
below the timeline.
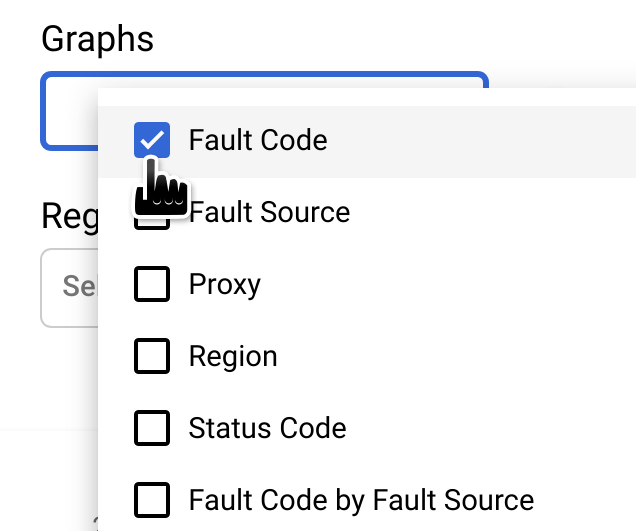
**Note:** If the Fault Code by Time graph
isn't currently displayed, select **Fault Code** in the **Graphs** menu to show it:
The circled column of the Fault Code by Time graph corresponds to the time interval containing
the time of the anomaly.
**Note:** A small difference between the data displayed in the graph
and the reported time of the anomaly is normal.

You observe that in the
interval `07:03 - 07:27`, there were 1499 responses with fault code
`steps.json2xml.SourceUnavailable` (an error code
that is returned when a JSON to XML policy message source is unavailable).
This is the fault code that triggered the anomaly.
By contrast, over the preceding four
intervals the average number of responses with that fault code was about 291, so the jump to 1499
was certainly an unusual event.
For more information about the `SourceUnavailable` error message, see
[JSON to XML policy runtime error troubleshooting](https://docs.cloud.google.com/apigee/docs/api-platform/troubleshoot/policies/runtime/jsontoxml-runtime-errors.md.txt).
At this point, there are a couple of ways to continue investigating the cause of the
anomaly:
- Drill down on the fault code data at the time of the anomaly by clicking the
cell for the anomaly in the Fault Code by Time graph.
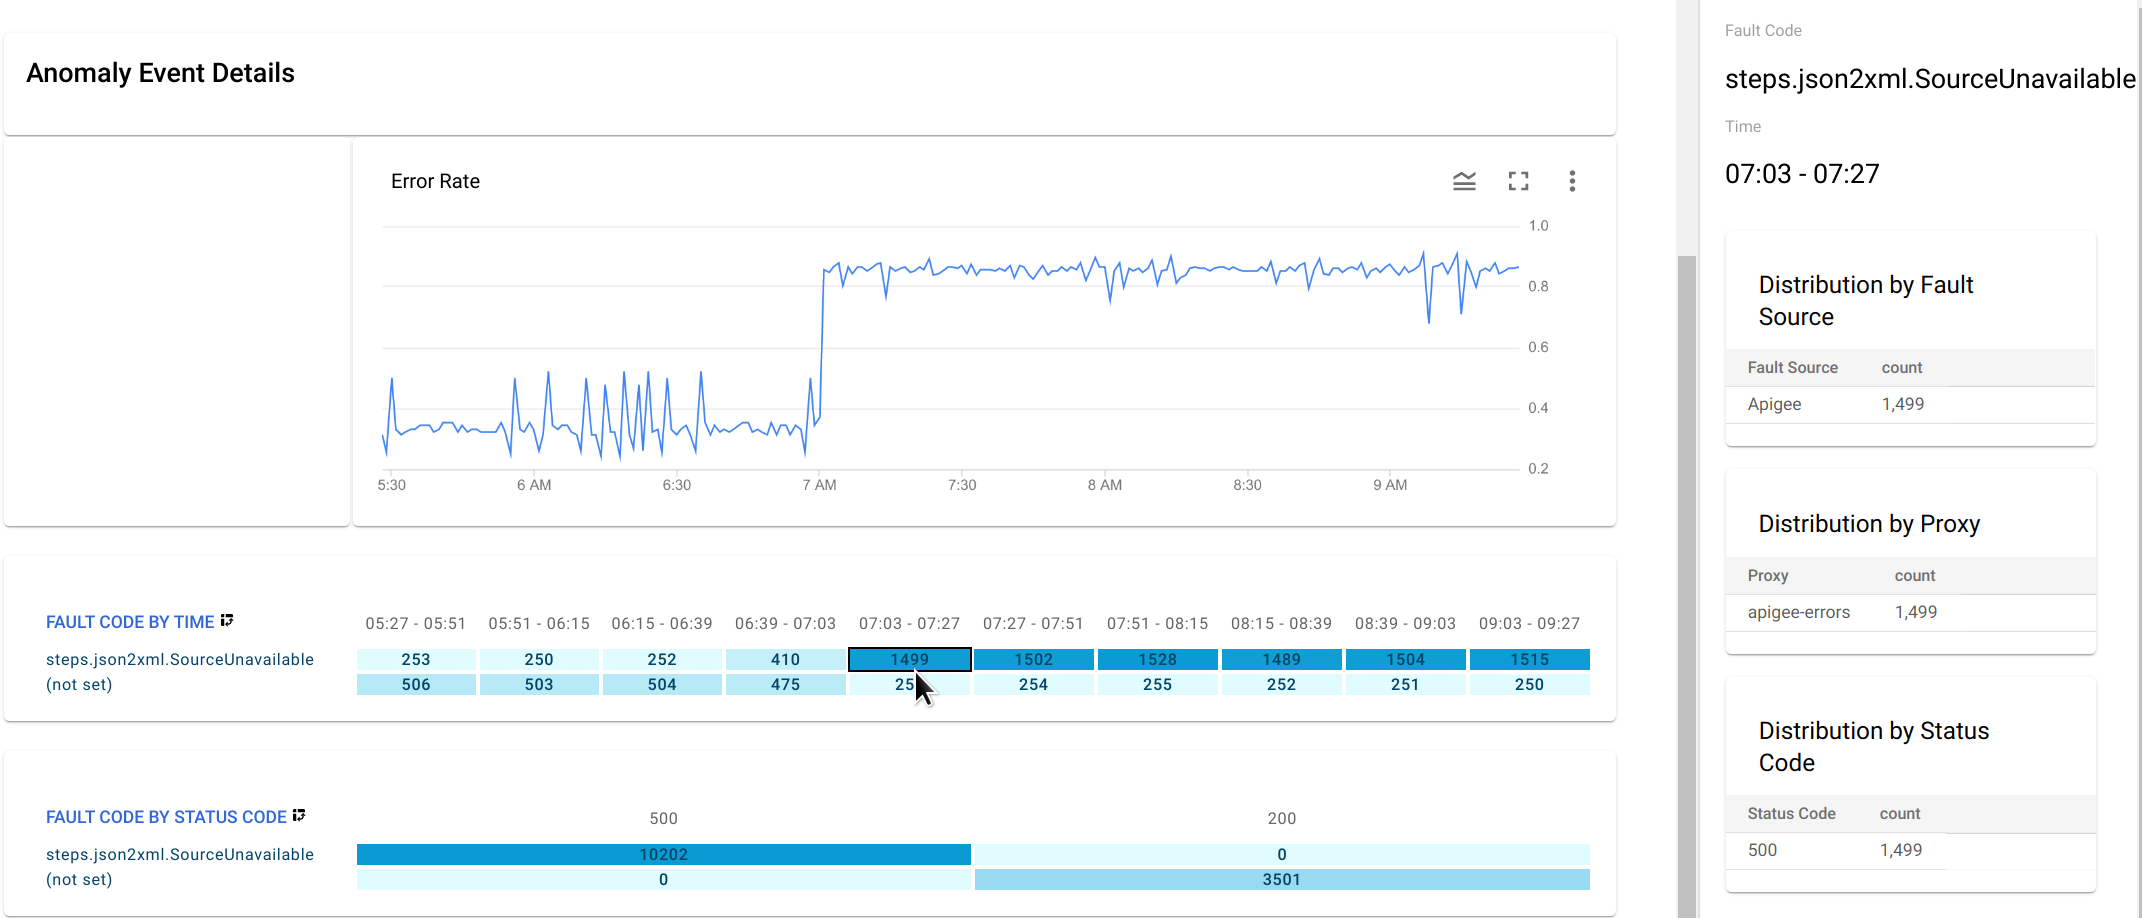
This displays distribution tables for `steps.json2xml.SourceUnavailable`
by fault source, proxy, and status code in the right-hand pane.
In this example, the tables don't provide any additional information
because all the fault codes arise from the same fault source, proxy, and
status code. But in other situations, the distribution tables can point you
to the location and cause of the anomaly.
- [Create an alert](https://docs.cloud.google.com/apigee/docs/api-platform/analytics/create-operations-anomalies-alerts.md.txt) for the anomaly and set up a notification. After you have done this, operations anomalies will send you a message whenever a similar event occurs in the future.