*This page
applies to **Apigee** and **Apigee hybrid**.*
*View [Apigee Edge](https://docs.apigee.com/api-platform/get-started/what-apigee-edge) documentation.*

The API Monitoring Timeline view displays timelines of
recent API traffic, to help you diagnose and investigate issues.
To access the Timeline view, follow the steps in
[Accessing API Monitoring](https://docs.cloud.google.com/apigee/docs/api-monitoring.md.txt#accessing_api_monitoring) and
select **Timeline**.
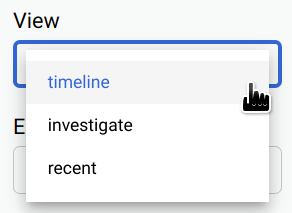
The figure below shows the UI with **Timeline** selected.
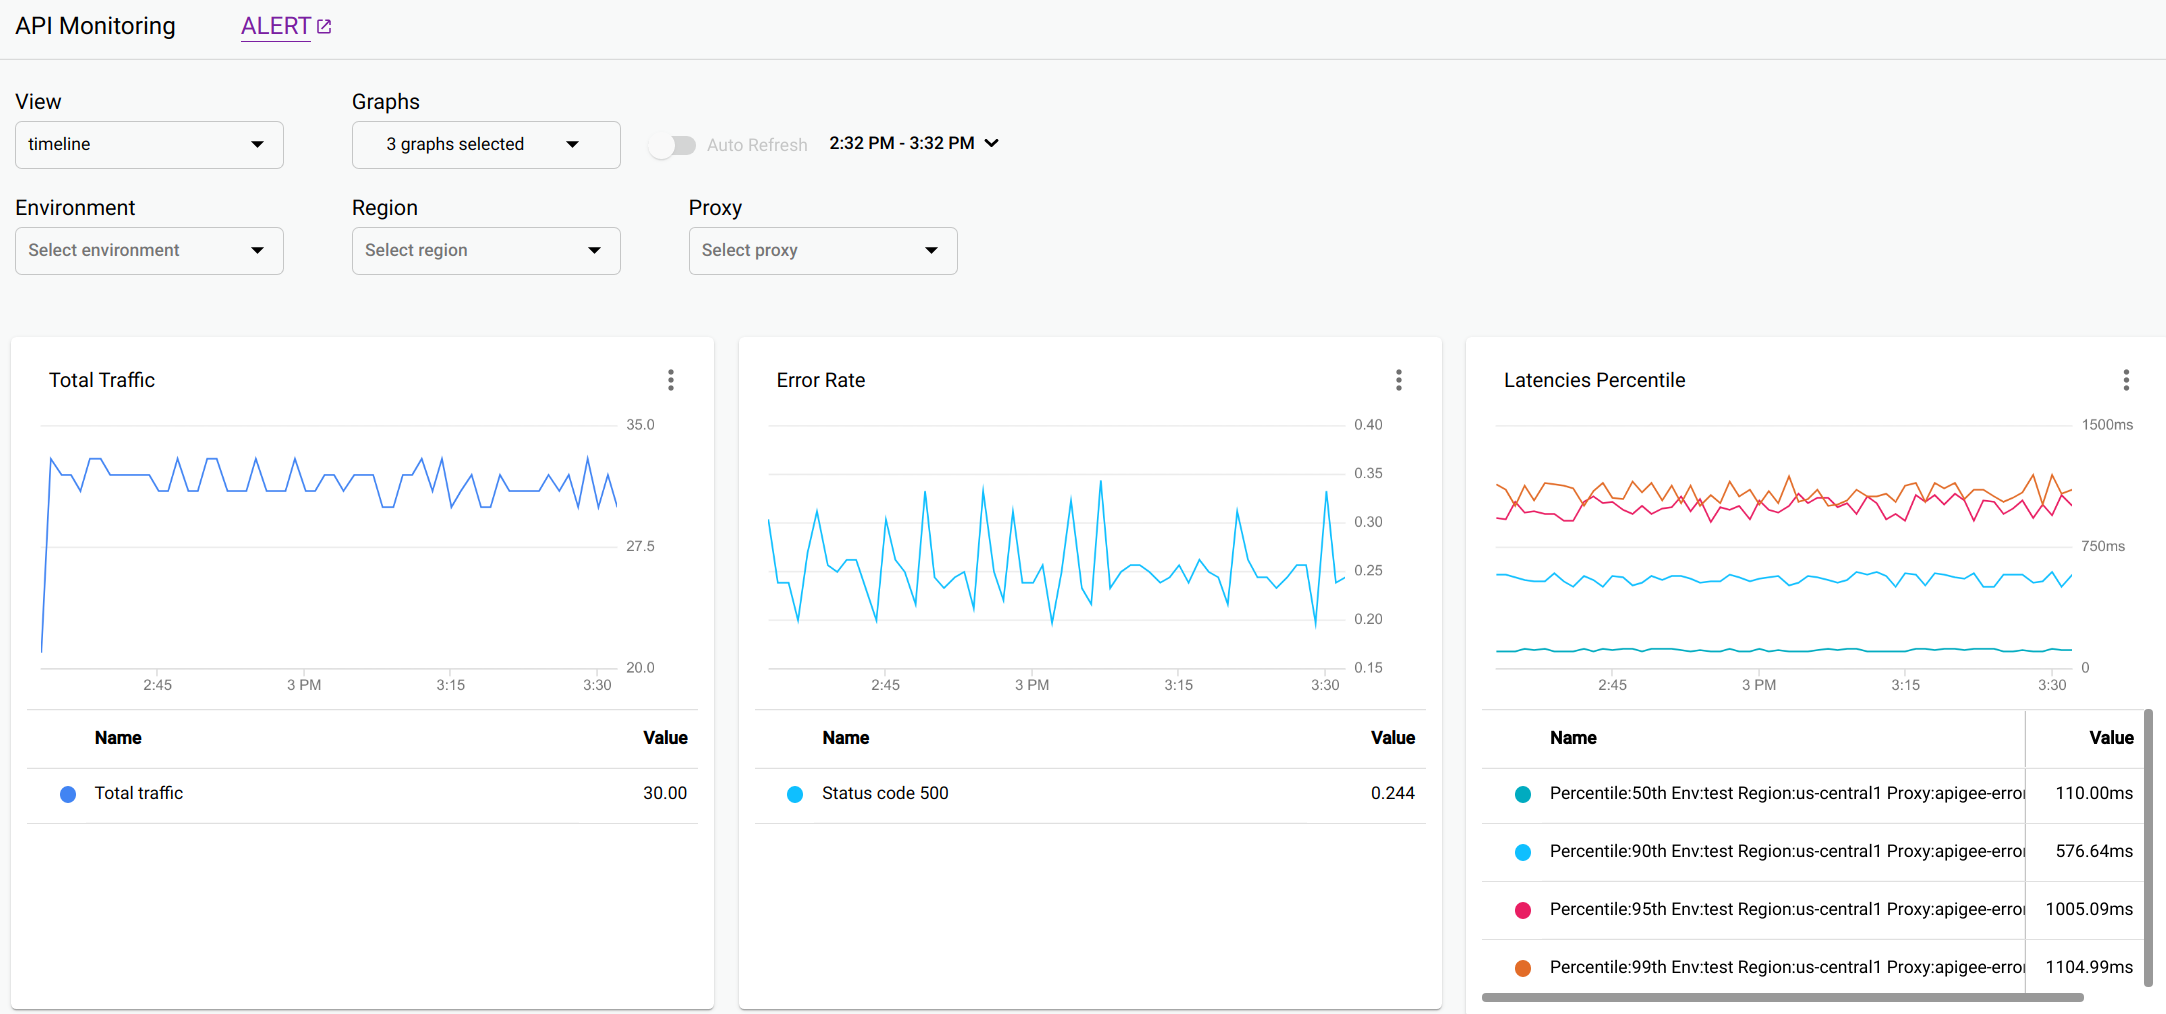
The Timeline view displays following graphs:
- **Proxy Total Traffic**: Numbers of requests during 1 minute intervals of the time range.
- **Proxy Error Rate**: Total errors (4xx and 5xx) divided by the total traffic in each interval.
- **Proxy Latencies Percentile** : Percentiles for API [latency](https://docs.cloud.google.com/apigee/docs/api-platform/analytics/latency-analysis-dashboard.md.txt). The graph shows the following percentiles: 50th (median) 90th, 95th, and 99th percentile.
- **Target Total Traffic**
- **Target Error Rate**
- **Target Latencies Percentile**
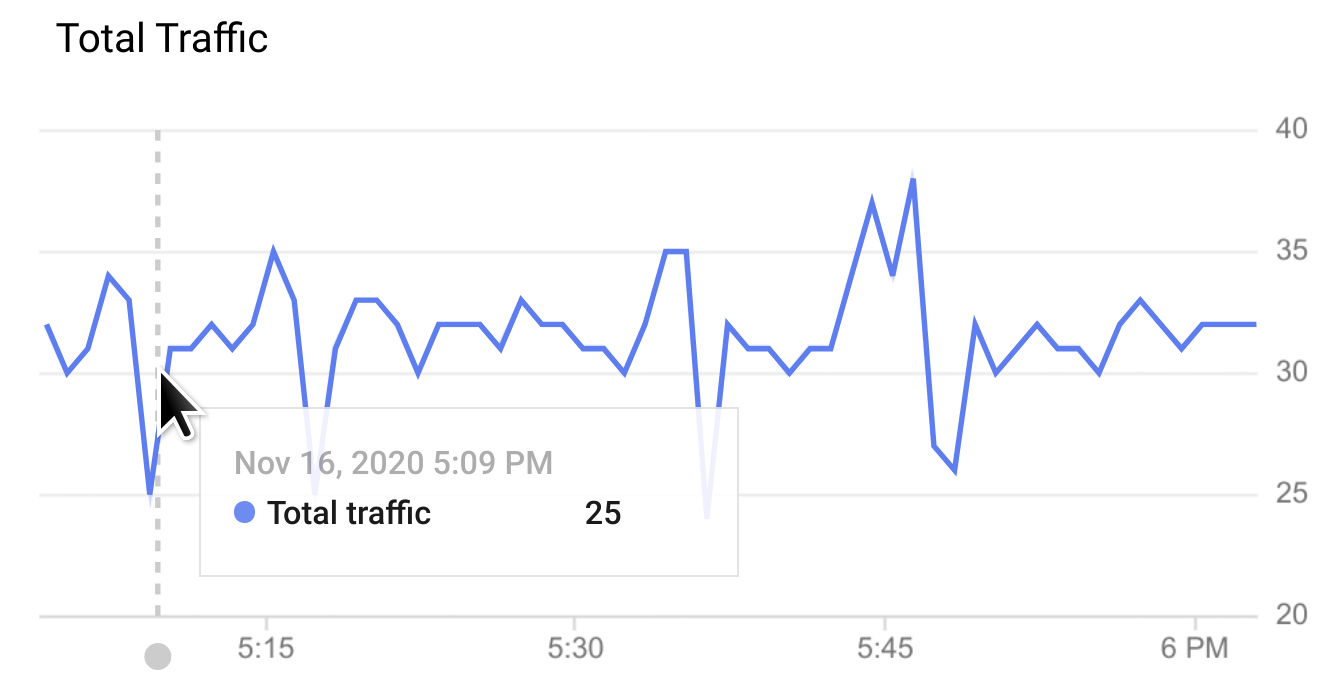
Hover the mouse over any point in a graph to display the values at that point.
You can choose which graphs to display in the **Graphs** drop-down menu.
## Graph options for all views
The following graph options are available in all three views: Timeline,
Investigate, and Recent:
- **ALERT** : Click **ALERT** to set up [alerts and notifications](https://cloud.google.com/monitoring/alerts) for events, such as spikes in traffic or latencies.
- **View**: Select one of the API Monitoring views:
- Timeline (shown above)
- Investigate
- Recent
- **Graphs**: Select the graphs to display from the drop-down list.
When you select the graphs, they are displayed in the order in which you
selected them, starting with the most recently selected.
- **Time range**: Select the length of the time range for the graphs.
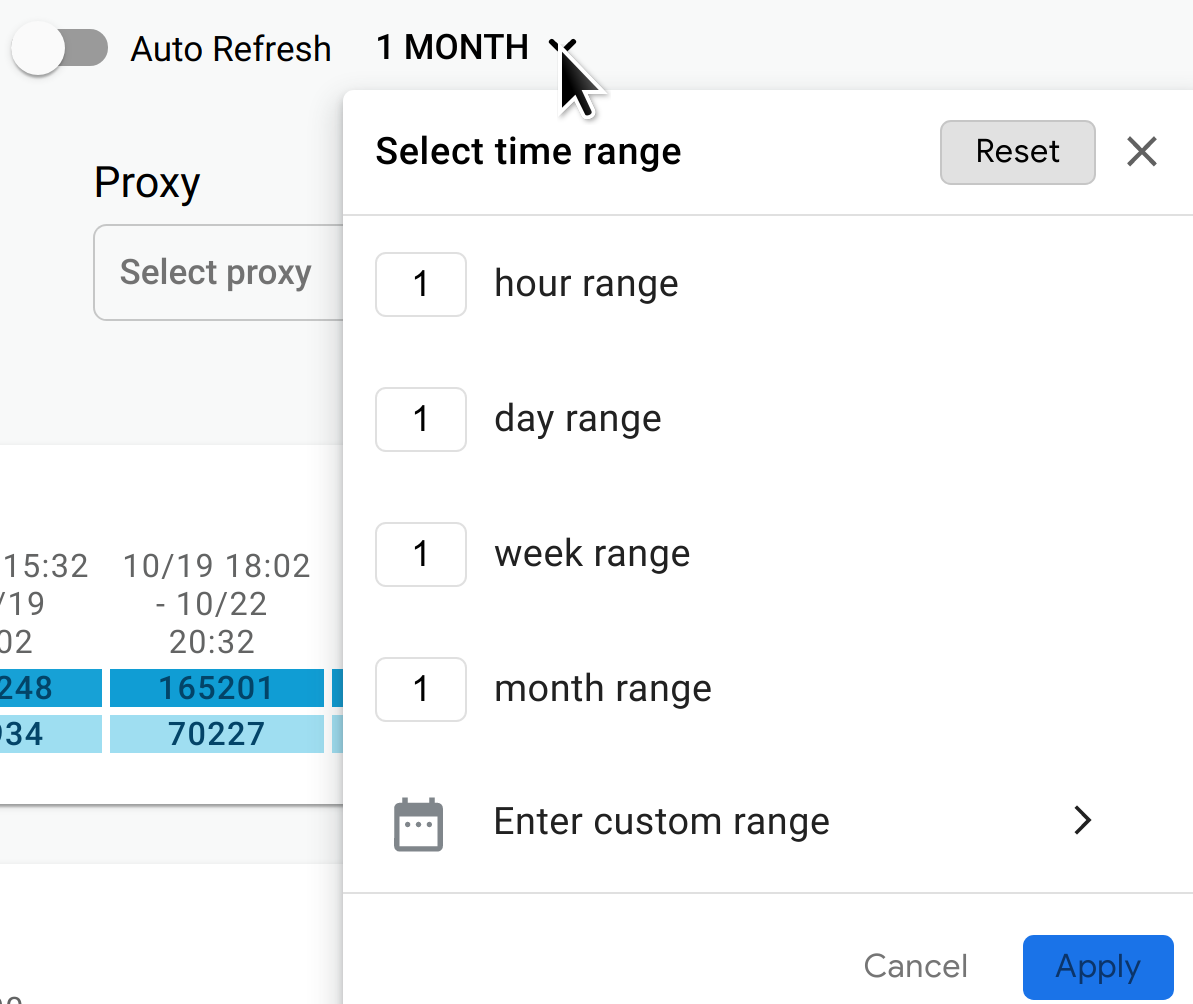
You can also turn on **Auto Refresh** to automatically refresh the data
once every minute.
- **Environment** : Select the
[environment](https://docs.cloud.google.com/apigee/docs/api-platform/fundamentals/environments-overview.md.txt)
for the API.
- **Region** (Timeline and Investigate views only): Select the API
[region](https://cloud.google.com/compute/docs/regions-zones).
- **Proxy** (Timeline and Investigate views only): Select the API
[proxy](https://docs.cloud.google.com/apigee/docs/api-platform/fundamentals/understanding-apis-and-api-proxies.md.txt).